A picture is worth a thousand words. And that’s why I believe charts can speak for themselves.
Back in November 2014 I highlighted the developing 5 wave pattern in Chipotle’s stock price . And earlier this week, I took a look at the rampant euphoria for hamburgers in America here by dissecting the Dow Jones Restaurant Index. Both pieces are good references for the charts below.
One of the high flyers – a company that makes really good burritos – might have just completed 5 waves up. Yep, we are at an important juncture for Chipotle (CMG).
Investors have long respected the long-term trend line but the chart certainly appeared to be carving out a 5 waves up (Elliott Wave) move from its IPO back in 2006. And this warned that Chipotle shares may be topping.
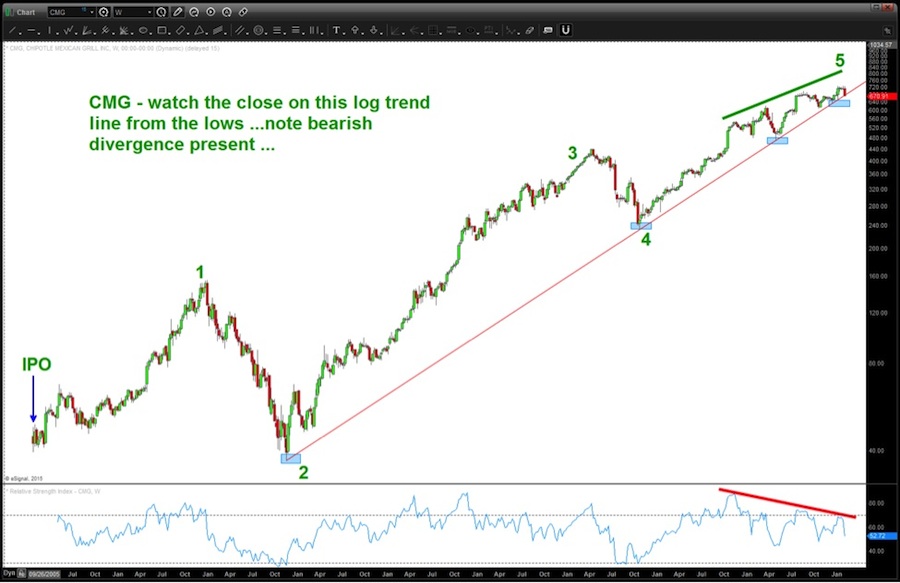
Taking another look at the chart of CMG you can see that after 4 weeks of consolidation at the highs it broke sharply lower. Also, take a look below: It is right up against the long term log trend line that held the bull market in check multiple times.
So this recent decline in Chipotle shares is an important one to watch.
Watch how CMG closes tomorrow and next week. As I posted back in November, if we get a close below this log trend line on a monthly and/or weekly basis “it might be time to cut and run.”
Chipotle Stock Chart – Trend Line Support
Chipotle (CMG) Elliott Wave Chart – 5 waves topping?
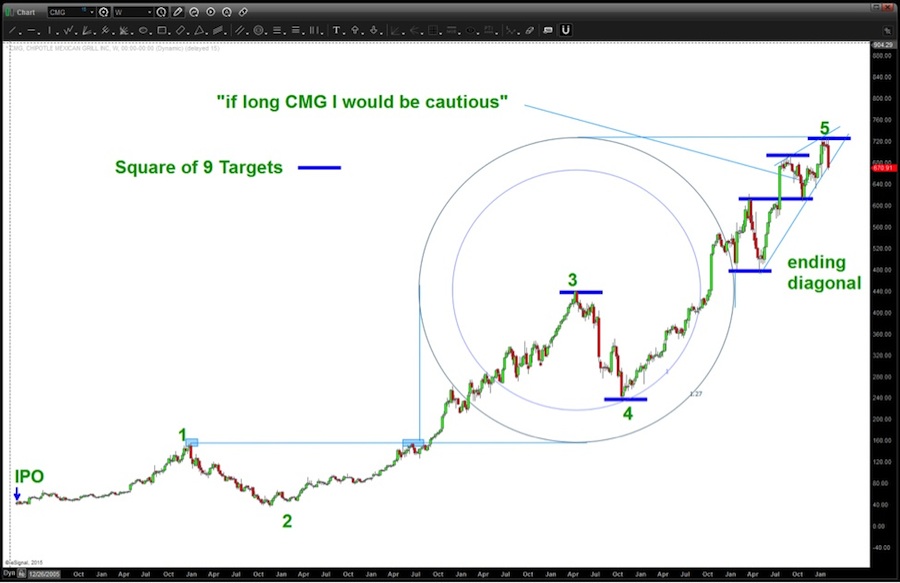
CMG – Square of 9 Table
Thanks for reading and have a good weekend.
Follow Bart on Twitter: @BartsCharts
No position in any of the mentioned securities at the time of publication. Any opinions expressed herein are solely those of the author, and do not in any way represent the views or opinions of any other person or entity.


 Rolling Over At Key Fibonacci Level?")

