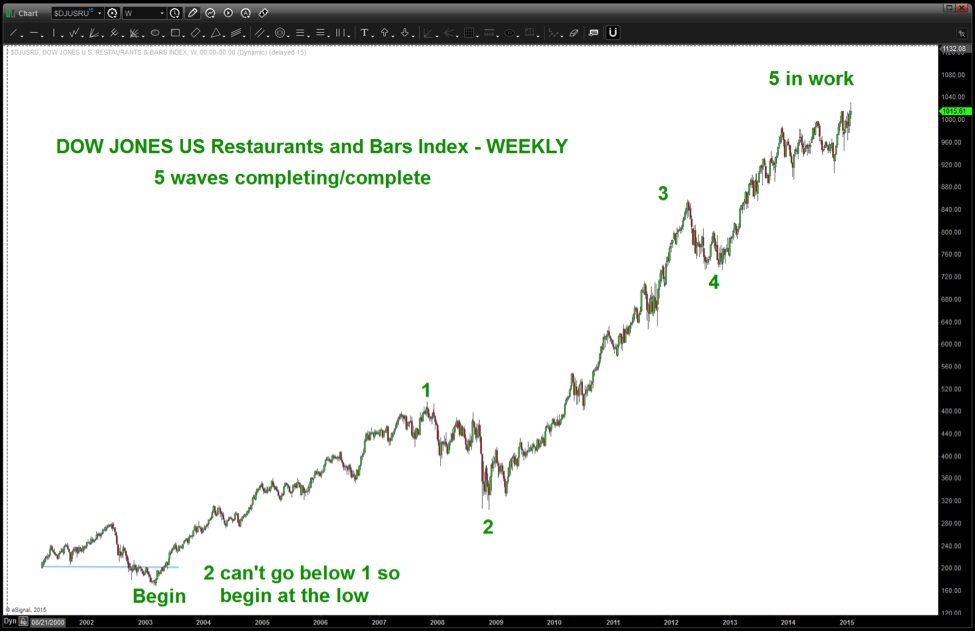
Dow Jones Restaurant Index is carving out a 5 waves higher move and there are multiple technical indications that this index is topping and ready to roll over – perhaps in a big way.
Good luck Shake Shack (SHAK), as you might have IPO’d on the date of the top in your index…
But a bigger question looms: Does this have ramifications for the state of the entire US equities market?
I’ll be honest with you here, when I did the Dow Jones Restaurant Index with the S&P 500 overlaid on top of it I expected to see some inflection points based on consumers or something. Folks, it is a mirror image of the Restaurant Index.
IF
DJ RESTAURANT INDEX TOPPING/TOPPED
THEN
SO
IS
THE US EQUITIES MARKET
DOW Jones Restaurant Index Chart – Topping?
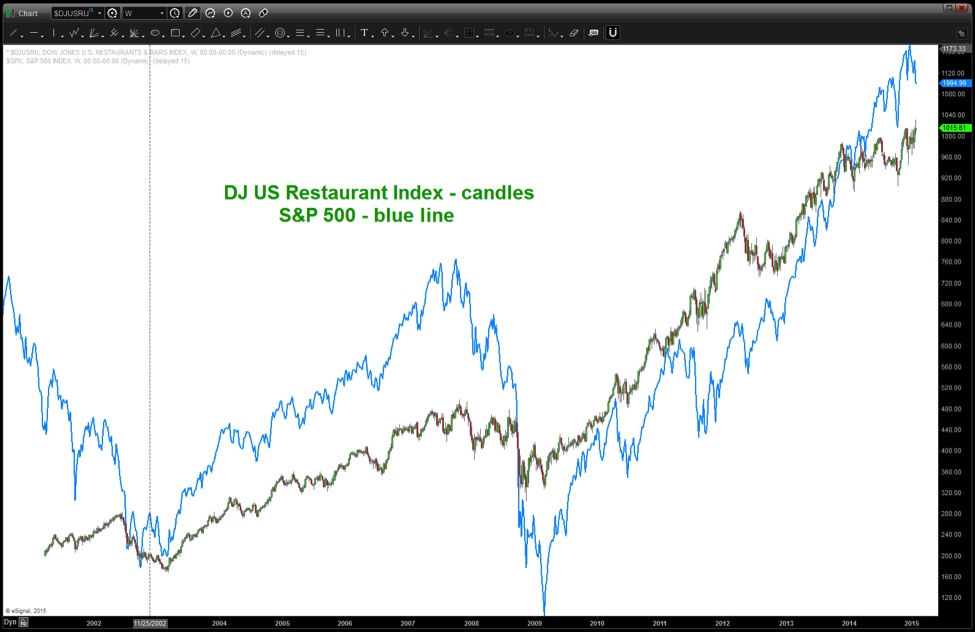
So, with a one to one overlay it shows that the index does work in conjunction with the S&P 500. What about the relative strength of the Restaurant Index versus the S&P 500 ($DJUSRU / $SPX)? Let’s check the chart out.
Note that if the blue line below is going UP then the DJUSRU is outperforming and vice a versa. This chart is fascinating. Pay close attention.
Restaurant Stocks Relative Strength Chart
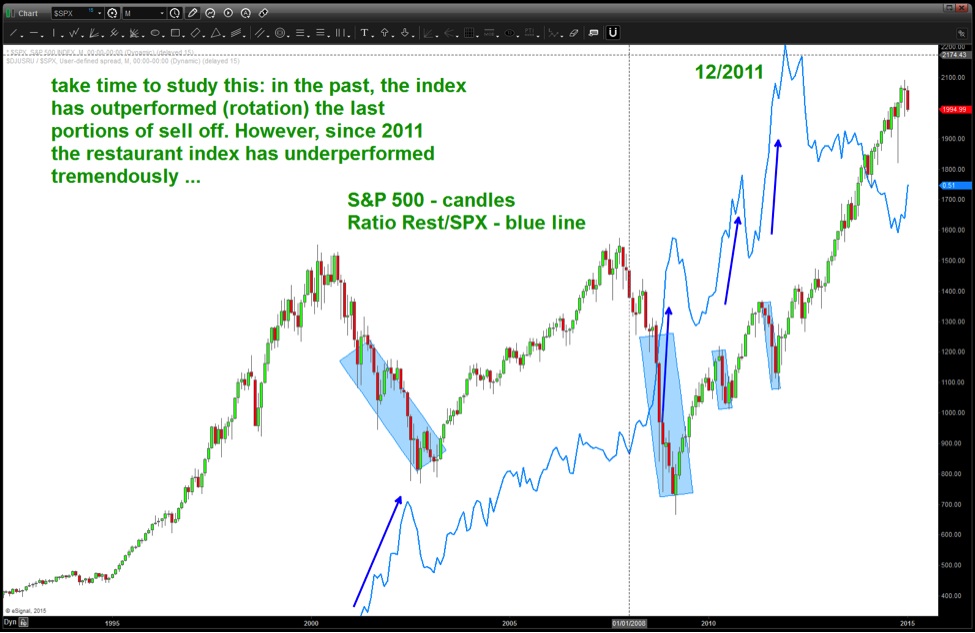
When the market has sold off, the DJUSRU has outperformed – tremendously. In the chart above the blue shaded rectangles represent the S&P 500 selling off into pretty big lows. Now, pay attention to the blue arrows on top of the blue line (representing the relative strength of the Dow Jones Restaurant Index versus the S&P 500) as the sell-off was occurring 1) rotation occurred and the DJUSRU index outperformed and 2) then topped and the market caught up and off it went. A case could be made that, presently, this might be happening BUT what if the index has completed a major 5 wave move up since it’s beginning in the early 2000’s? Interesting to say the least ….
The follow on charts below will show the following:
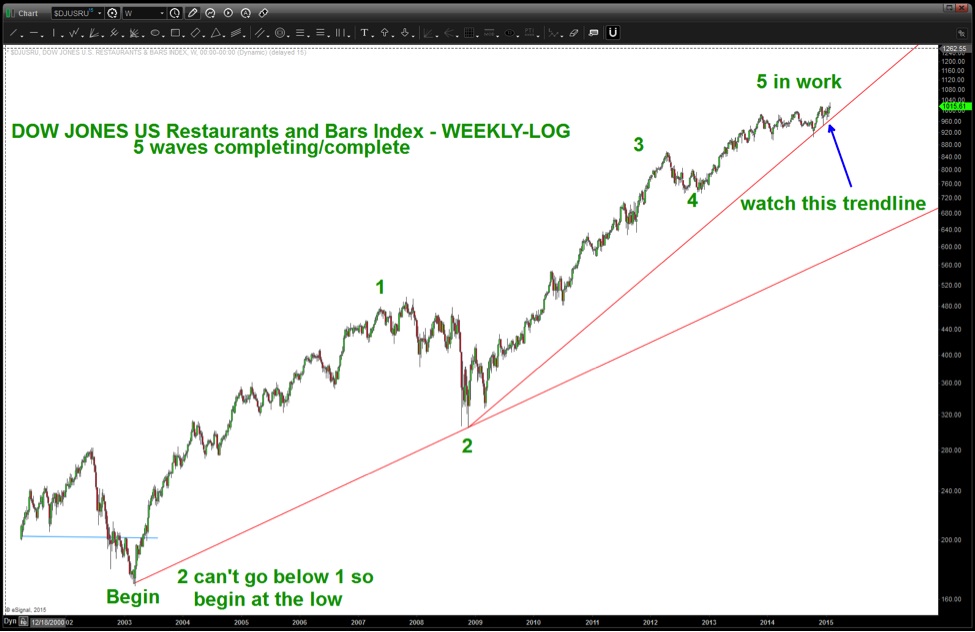
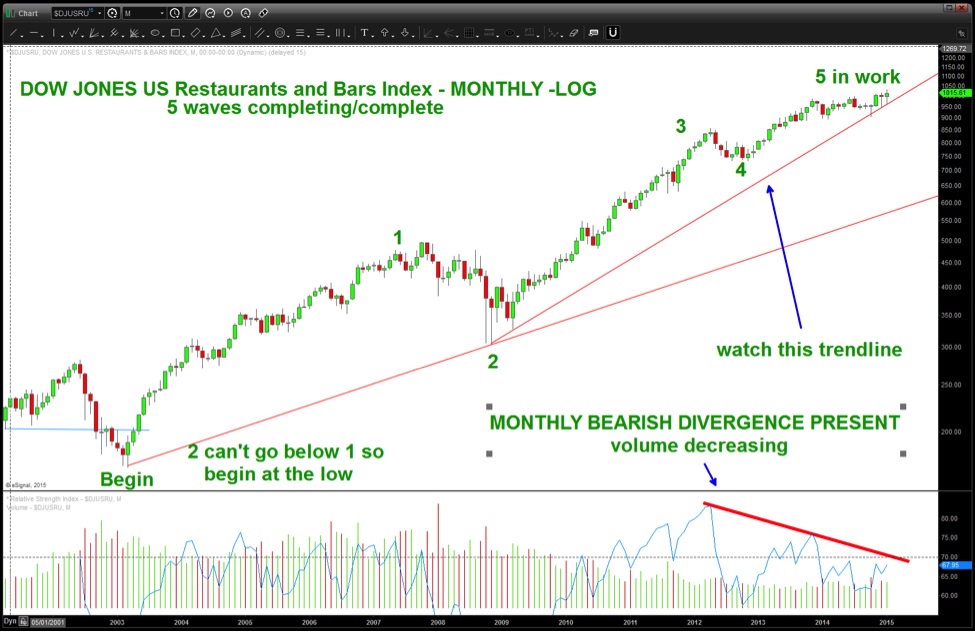
- 5 waves up complete w/ Monthly Bearish Divergence present on decreasing volume
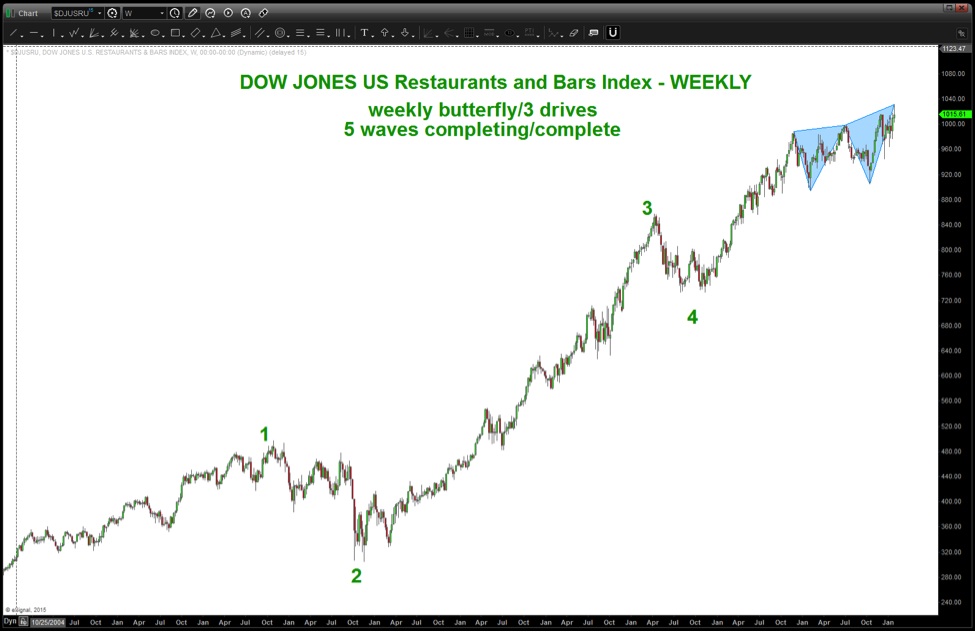
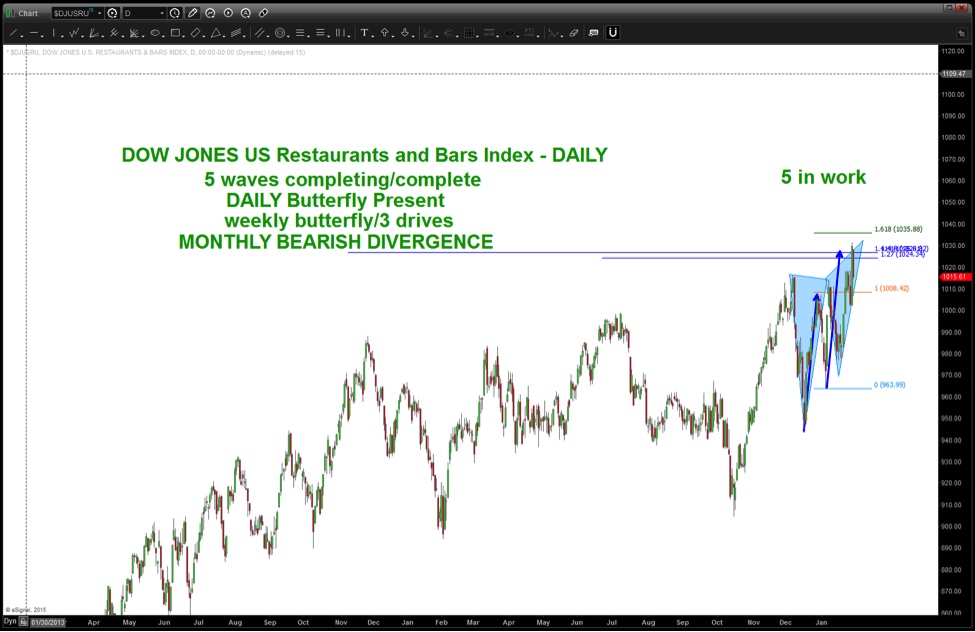
- Weekly and Daily Butterfly Sell Patterns completing
- Confluence of Square of 9 targets present
- A key log trend line to watch for weakness. A weekly close below would be a signal to get defensive, immediately.
Just objectively view the information presented… and SUPER SIZE ME!
Square of 9 Table
Dow Jones Restaurant Index Weekly Chart – linear
DJ Restaurant Index Weekly Trend Chart – log
DJ Restaurant Index Monthly Chart – Log with wave patterns
DJ Restaurant Index Weekly Chart – 3 Drive To A High
Dow Jones Restaurant Index Chart – Wave 5 price targets
Thanks for reading and make it a great week.
Follow Bart on Twitter: @BartsCharts
No position in any of the mentioned securities at the time of publication. Any opinions expressed herein are solely those of the author, and do not in any way represent the views or opinions of any other person or entity.

: Showing Some Signs of Emerging Strength")
