When this market cycle finally comes to an end, among the sectors that will be remembered as one of its key drivers is biotechnology. With a gaudy 750% gain since its 2009 lows, the Biotech run had been so hot, it attracted “bubble” talk in its descriptions, including by us back on March 23, 2015 (backslap: the run actually topped the very day before that post, save for a brief, failed higher high that July).
Since then, the biotechnology sector has fallen on tougher times, leading to calls that a top is indeed in. We don’t know if that’s the case or not. However, with distinct lower highs now on the chart, the sector is one breakdown away from making a more compelling “top is in” case. It very well may get that opportunity in short order.
The most popular index in the sector is the NYSE ARCA Biotechnology Index (INDEXNYSEGIS:BTK). Since 2008, the BTK has been riding an Up trendline on its log scale chart. This Biotechnology sector trendline begins at the shock low in November 2008, and connects the lows in March 2009, November & December 2011 and February & June of this year. After the selloff in the sector over the past few weeks, the BTK finds itself once again testing this major post-2008 Up trendlin around the 3000 level. To boot, the index is also presently testing the top side of its post-2015 Down trendline (also on a log scale) that it broke above this past July.
Biotechnology Index Chart – watch that trend line!
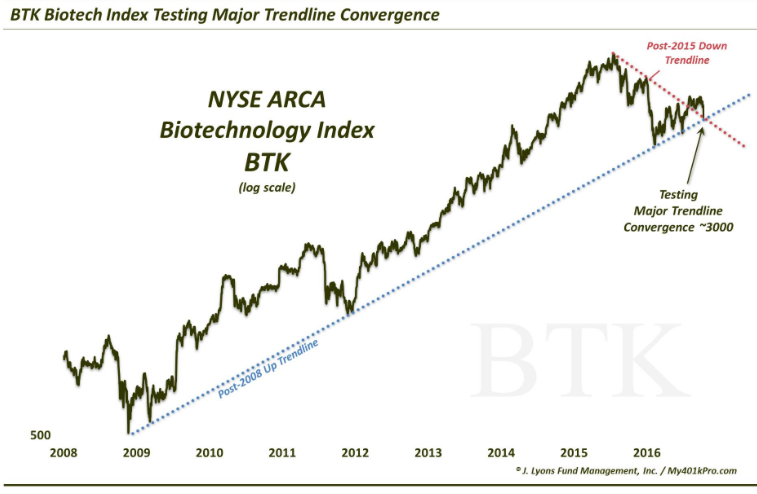
This convergence of trendlines should provide for staunch support in the BTK and biotech stocks – at least in the short-term. Our concern in this case, as we have mentioned often, is that the increased frequency (i.e., decreased time lapse) of trendline touches is often a harbinger of a forthcoming trendline break. If that is the case here, after whatever short-term bounce may materialize, we can likely expect to see this Biotechnology sector trendline eventually give way.
Should that occur, significant further downside may be in store for this formerly frothy leader. Potential linear chart trendline support lies near 2900. Below that, the index could be in store for a re-test of the February lows just south of 2600. Longer-term, it could get much uglier than that given typical post-bubble price behavior.
Lest one thinks a major breakdown is unlikely to occur in this sector, consider the fact that biotech’s sister sector, pharmaceuticals, recently broke an identical 8-year Up trendline. Furthermore, other major indices are breaking shorter-term trendlines left and right this week.
Thus, while biotech has been a star sector for the better part of a decade, one might not want to be married to the sector given that its uptrend is hanging in the balance here. Because if these trendlines are in fact snapped, we assure you that it won’t be so fashionable to own biotech stocks anymore.
Also read: Charting Silver’s Turbulent Price Action
Thanks for reading.
Twitter: @JLyonsFundMgmt
Read more from Dana’s Tumblr Blog
Author may have positions in mentioned securities at the time of publication. Any opinions expressed herein are solely those of the author, and do not in any way represent the views or opinions of any other person or entity.

: Worrisome to Broader Market?")

