Of the many financial assets that put in lows of some magnitude in early 2016, silver has been among the biggest gainers. From its January low to the early August peak, the iShares Silver Trust (NYSEARCA:SLV) rose precisely 50%. But since then, it’s been a rocky road.
Especially during the first week of trading in October. And this has caused some technical concerns.
The Early October Silver Decline
To understand where Silver is at technically (price action), we’ll need to take a step back and recap the action.
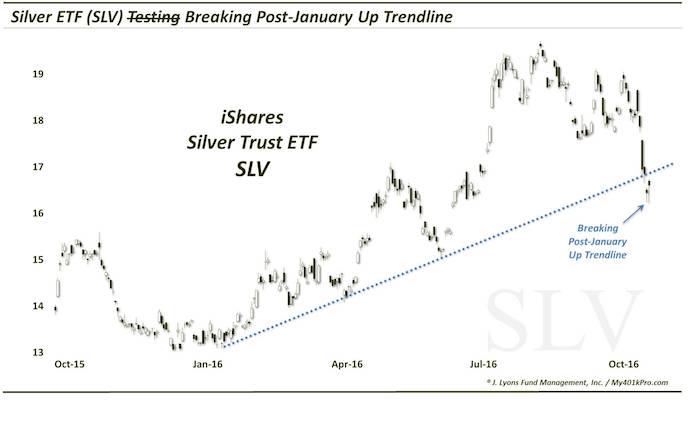
On a log scale, one can draw an upward-sloping trendline connecting the January, April and June lows to define the post-January uptrend.
During trading last week, SLV broke through its uptrend line (near the 17 level). The momentum carried SLV as low as 16.24 before closing at 16.60.
This trend break doesn’t necessarily mean the post-January uptrend is over. However, it signifies, at a minimum, a move to a lower trajectory of advance. Additionally, this break represents a loss of intermediate-term momentum that will likely require some more corrective action in terms of either price, time or both.
Silver ETF Chart (SLV) – Momentum Lost?
Thanks for reading.
Twitter: @JLyonsFundMgmt
The author does not have a position in mentioned securities at the time of publication. Any opinions expressed herein are solely those of the author, and do not in any way represent the views or opinions of any other person or entity.

: Showing Some Signs of Emerging Strength")

