The following is a recap of the August 5 COT Report (Commitment Of Traders) released by the CFTC (Commodity Futures Trading Commission) looking at COT data and futures positions of non-commercial holdings as of August 2.
Note that the change in COT report data is week-over-week. Excerpts of this blog post originally appeared on Hedgopia.com – Paban’s blog.
July 22 COT Report – Trading Insights and Analysis
EQUITIES
E-mini S&P 500: The SPDR S&P 500 ETF (NYSEARCA:SPY), in the week ended Wednesday lost $897 million (courtesy of ETF.com). This followed inflows of $2.1 billion in the prior week. The post-Brexit two-session sell-off ended on June 27th; since then, SPY has attracted $4.1 billion.
No such luxury for U.S.-based equity funds. Nearly $11 billion has been withdrawn since the week ended June 29th. Through Wednesday this week, another $3.6 billion came out. The $7.8 billion in inflows in the week to July 13th has now been replaced by three weekly outflows totaling $10.5 billion.
Despite this, the S&P 500 (INDEXSP:.INX) hung in there. The drastically lowered earnings bar has helped.
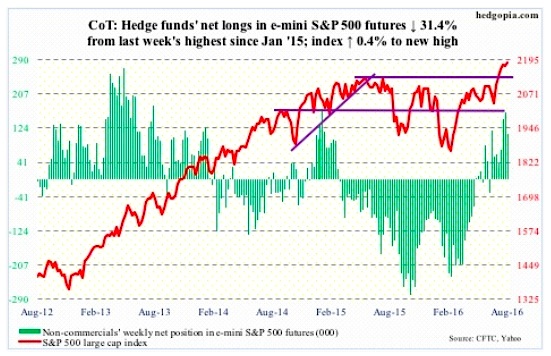
Last week’s hanging man candlestick was negated, but in the process the week produced another. This is a candle that can suck in short sellers, becoming a source of squeeze. In this scenario, rather than becoming a bearish reversal signal, it becomes a continuation pattern. Hence the need to get confirmation if it is sending a bearish signal to stock market bulls.
Current market conditions remain overbought. Daily Bollinger Bands have massively tightened.
August 5 COT Report Data: Currently net long 111.3k, down 50.8k.
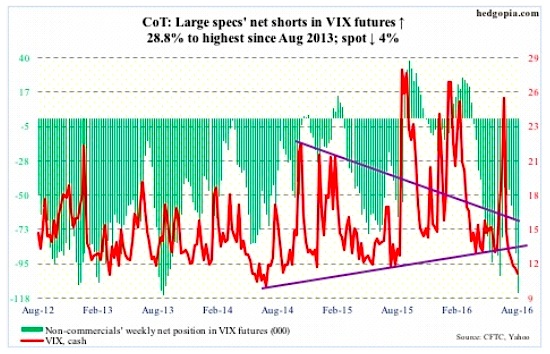
VIX: Spot VIX closed the week under 12 as well as slightly below the lower Bollinger band. This was the week’s third sub-12 reading. Bollinger bands have tightened; only a little over two points separate the two.
That said, on Monday through Wednesday, spot VIX continued to struggle to hang on to the gains, and continues to hover near the lower end of years-long range.
The VIX-to-VXV ratio has been in oversold territory the past six weeks, with the last four in the mid to high 0.70s and the first two in the low 0.80s. The rubber band is stretched!
August 5 COT Report Data: Currently net short 114.6k, up 25.7k.
COMMODITIES
Crude oil: Forced to fight for market share, Saudi Arabia cut prices for Arab Light crude sold to Asia by the most in 10 months. Iran’s production has gone up 25 percent this year, and aims to reach four million barrels per day by year-end. Iraq last month exported a record amount of crude. Here in the U.S., rigs are going up. Markets are once again beginning to worry about oversupply.
Spot West Texas Intermediate crude lost 24 percent in a little less than two months through Wednesday before responding to weekly U.S. data with a 3.3-percent rally, followed by a 2.7-percent rise on Thursday.
The EIA data showed that in the week ended last Friday U.S. crude inventory continued to rise, by 1.4 million barrels to 522.5 million barrels. Stocks are now down 20.8 million barrels from the April 29th high of 543.4 million barrels, which was the highest since the all-time high 545.2 million barrels in October 1929.
Distillate stocks rose 1.2 million barrels to 153.2 million barrels – a 12-week high.
Crude imports rose 301,000 barrels per day to 8.7 million b/d – the highest since October 19, 2012.
On Wednesday, markets instead decided to focus on gasoline stocks, which dropped 3.3 million barrels to 238.2 million barrels – a six-week low.
Crude production dropped, too, by 55,000 b/d, to 8.5 mb/d. Production is down big since peaking at 9.61 mb/d in the June 5th week last year.
Refinery utilization rose nine-tenths of a point to 93.3 percent – a 35-week high.
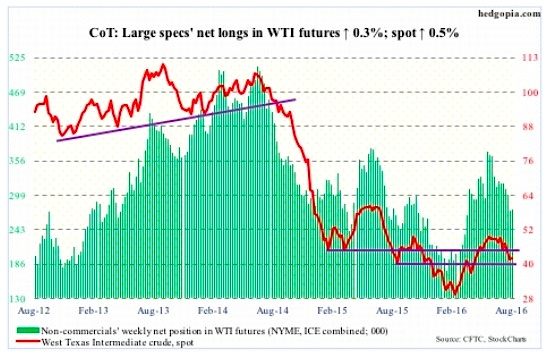
Spot WTI remains oversold, particularly on the daily chart. If oil bulls put their foot down and push it higher, the area of interest remains $42.50-$43/barrel support, which was broken during the latest sell-off. Then comes the declining 50-day moving average ($46.56), which approximates a falling trend-line resistance from the June 9th high.
August 5 COT Report Data: Currently net long 275.3k, up 706.
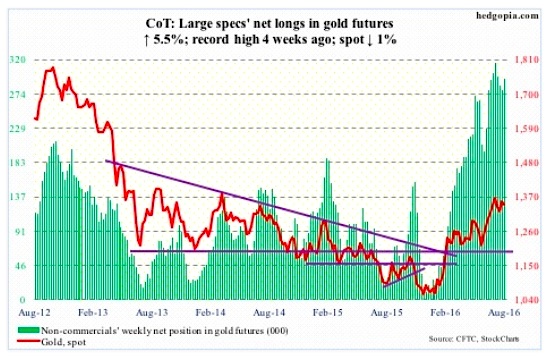
Gold: On Tuesday, spot gold managed to test the July 6th high of $1,377.5/ounce, but was rejected … near the daily upper Bollinger band. The daily chart for gold has entered overbought territory, and can come under pressure in the right circumstances.
The week ended Wednesday reversed the recent trend of outflows from the SPDR gold ETF (NYSEARCA:GLD), attracting $680 million. This preceded outflows of $1.2 billion in the prior three (courtesy of ETF.com).
August 5 COT Report Data: Currently net long 294.2k, up 15.2k
CURRENCIES
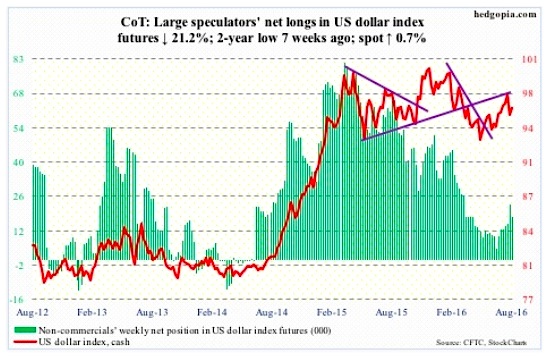
US Dollar Index: Can go both ways depending on if daily (oversold) or weekly (overbought) conditions prevail. Should it come under pressure, support lies at 94.50-95, which approximates a rising trend line drawn from the low in early May. The 200-day moving average should provide resistance on the upside.
August 5 COT Report Data: Currently net long 17.7k, down 4.8k.
Economic Calendar and Insights
The NFIB small business optimism index for July is published on Tuesday. It rose 0.7 points month-over-month in June to 94.5. The cycle high of 100.3 was reached in December 2014, which was the highest since October 2006.
Also on Tuesday comes out productivity data for 2Q16. Non-farm business sector output per hour fell at 0.6-percent annual rate in 1Q16. In 4Q15, productivity decreased 1.7 percent. From 1Q15 to 1Q16, productivity rose 0.7 percent; this was the sixth straight sub-one percent quarter.
JOLTS for June is published on Wednesday. May was down 345,000 m/m to 5.5 million. Openings have essentially gone sideways since July last year – 5.79 million back then versus 5.85 million this April.
Friday brings retail sales (July), PPI-FD (July), and University of Michigan’s consumer sentiment (August).
Retail sales rose 0.6 percent m/m to a seasonally adjusted annual rate of $457 billion in June. This was the third straight monthly increase. Sales rose 2.7 percent year-over-year.
Producer prices jumped 0.5 percent in June – the largest increase since May 2015. In the 12 months through June, prices rose 0.3 percent – the first increase since December 2014. Core PPI rose 0.3 percent m/m and 0.9 percent in the 12 months through June.
Consumer sentiment dropped 3.5 points m/m in July to a three-month low 90. Sentiment peaked at 98.1 in January 2015 – an 11-year high.
Thanks for reading.
Twitter: @hedgopia
Author may hold a position in mentioned securities at the time of publication. Any opinions expressed herein are solely those of the author, and do not in any way represent the views or opinions of any other person or entity.


")
 Rolling Over At Key Fibonacci Level?")

")
