April 27 stock market futures outlook – The FOMC release today is at 2pm eastern. We trade in a tight range on the S&P 500 futures (ES_F), unlike the Nasdaq 100 futures (NQ_F), which fell rapidly and steeply on Apple’s (AAPL) earnings.
For the S&P 500 futures, our support and resistance levels remain the same. For several trading days now, support is soft and extends into 2071 from 2076.5. We remain trapped in a range that could press into old levels of resistance, but until we see a breach and retest of the congestion levels near 2098 with momentum, we are such to stay in this choppy mode. Heavy congestion with neutral momentum sits between 2082 and 2087.
A breach above there and we should expand into 2091.5 and the charts could really open above into 2097.75. Because of momentum, any range expansions will fail and return to breakout levels.
The Morning Report: Here Comes The Fed
The weight of motion is still on buyers advancing and holding the key support level of 2082. Though we have lost the region, we see buyers quickly picking up open supply and driving the price north. In these spaces, it is important to watch for lower highs to signal sellers on the advance, and watch for buyers to drive higher lows as they build new support structures. When the market is muddy, it becomes increasingly important to watch the market form created by the buyers and sellers to trade intraday with success.
And remember the FOMC release time at 2pm.
Momentum on the four hour chart across April 27 stock market futures is neutral, but rising. Rangebound behavior is likely, but as long as charts hold support regions noted near 2077.75, we’ll see buying strength hold through the day.
See today’s economic calendar with a rundown of releases.
THE RANGE OF THURSDAY’S MOTION
Crude Oil Futures (CL_F)
April 27 Crude Oil outlook – The API report showed a draw on inventory, creating a very bullish overnight space that is holding. Now that the EIA report is out at 10:30am today. We definitely began the day under a bullish light yesterday, and today is the same. If the EIA report is above the API draw, we’ll see another spike, but we are finally at the targets I have been looking for on the expansion (see Monday’s post) – so now we look at the regions near 45.3 – 45.7 to show up as resistance at the first pass. However, if the bullish action holds, we see higher levels from 45.86, and 46.04 to 46.23.
Today, the trading ranges for crude oil are 43.65 -45.79. Our slant should remain bullish, though cautiously. As always, my eyes look for the lower highs in these spaces, or tests of lower support under weaker momentum to reverse my bullish slant through the day’s price action.
Moving averages in oil are bullish on tighter intraday time frames, and bullish to mixed on longer time frames. Support levels are still near 43.3 – 43.6.
Intraday long trade setup suggests a long off a 44.86 retest, or the 44.11 positive retest on the pullback (check momentum here at low level bounce, and watch the region at 44.49 for sellers) into targets of 44.12, 44.4, 44.65, 44.83, 45.13, and if buyers hold on, we’ll see 45.27, 45.46, and 45.7.
Intraday short trade setup suggests a short below a 44.06 failed retest, or the failed retest of 44.78 (with negative momentum prevailing) sends us back through targets at 44.64, 44.4, 44.15, 43.97, 43.74, 43.57, and 42.87, if sellers hang on.
Have a look at the Fibonacci levels marked in the blog for more targets.
E-mini S&P 500 Futures (ES_F)
Below is a S&P 500 futures chart with price support and resistance trading levels for today. Click to enlarge.
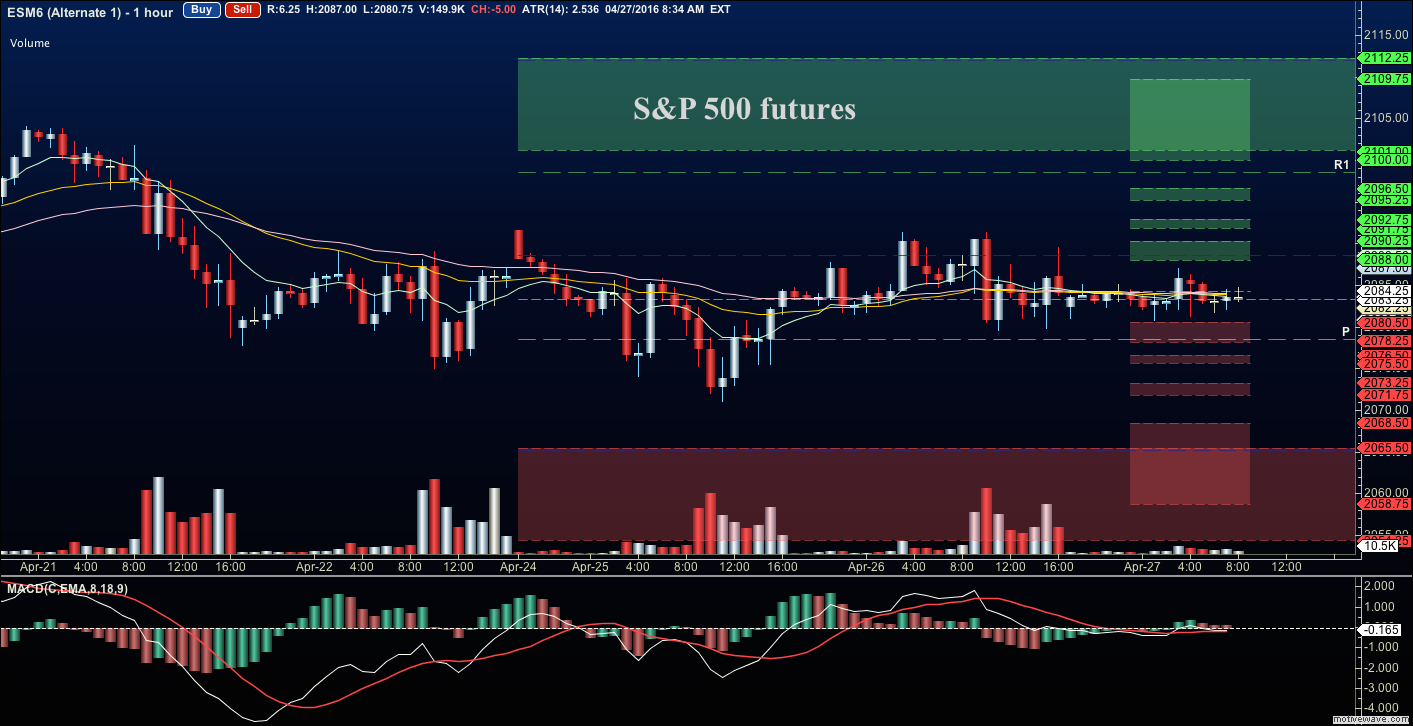
Outlook for Apr 27, 2016 -ES_F – The levels between 2098.75- 2104.25 still serve as important resistance. Front line support sits near 2071.5- 2074 region. Buyers are holding support for now in a moving average squeeze, but with damp momentum. This formation is entering its third day, and we are seeing squeezing moving averages, so we are about to see some kind of move. Watch the edges of 2092 resistance and 2076 support – the breaches of these levels are likely to open price expansion.
Upside motion has the best setup on the positive retest of 2082.75 or a bounce off 2079.75 with positive momentum – keep your eyes on 2082.25, and on congestion at 2085.75 -2088.75 with this 2077.75 entry. I use the 30min to 1hr chart for the breach and retest mechanic. Targets from 2079.25 are 2082.5, 2085.75, 2088.25, 2091.5, 2094.5, and if we can catch a bid there, we could expand into 2098.5 to 2104.75. Long action is still trending over the bigger picture for now, but momentum continues to slow. We open the day with neutral momentum.
Downside motion opens below the failed retest of 2078.75 or at the failed retest of 2086.25 with negative divergence. Retracement into lower levels from 2086 gives us the targets 2084.50, 2082.5, 2078, 2075.25, 2072, and perhaps 2071.5 to 2068.5. Buyers should still come to the rescue at the deep support, particularly at the first pass.
Have a look at the Fibonacci levels marked in the blog for more targets.
If you’re interested in the live trading room, it is now primarily stock market futures content, though we do track heavily traded stocks and their likely daily trajectories as well – we begin at 9am with a morning report and likely chart movements along with trade setups for the day.
As long as traders remain aware of support and resistance levels, risk can be very adequately managed to play in either direction as bottom picking remains a behavior pattern that is developing with value buyers and speculative traders.
Thanks for reading.
Twitter: @AnneMarieTrades
The author trades stock market futures every day and may have a position in mentioned securities at the time of publication. Any opinions expressed herein are solely those of the author, and do not in any way represent the views or opinions of any other person or entity.


 Rolling Over At Key Fibonacci Level?")
