Expectations for growth going forward remain muted, which provides a lower bar to clear.
Check out the yearly GDP growth chart below.
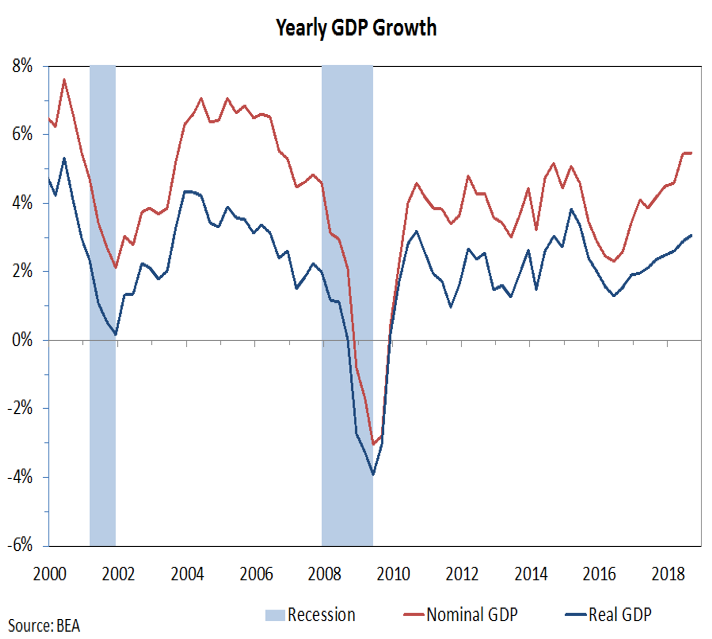
Valuations remain Bearish.Improving economic growth has helped fuel an uptick in corporate top-line growth this year (running better than 9% for Q3). Combined with record profit margins (aided by recent tax cuts), this has translated into earnings growth that is running above 30% in Q3. The dramatic improvement in the earnings backdrop while prices have been volatile has helped improve valuations for stocks. Two cautions, however, need to be stressed. First, most valuation measures indicate that stocks are still far from inexpensive at these levels (less expensive, but still costly). Second, the tax cut aided surge in earnings growth this year is likely to be followed by slower growth next year and the slowdown in growth could catch investors by surprise.
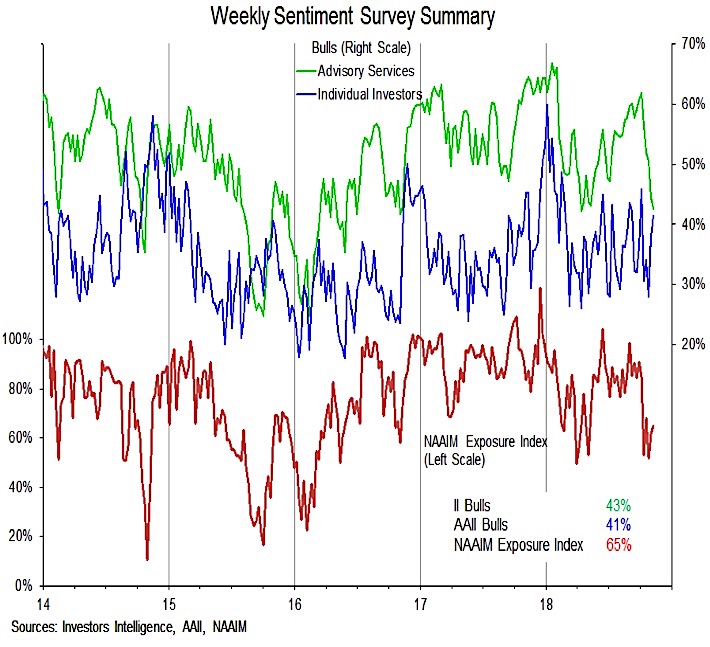
Sentiment overall continues to be Neutral.Coming into October, most measures of investor sentiment were moving toward their highest levels since January. Weakness in October produced, as is often the case, a brisk reassessment of these views and optimism receded. Importantly, we have not seen evidence of widespread investor capitulation. Some of the short-term indicators have moved to levels of extreme pessimism, but the surveys presented here have seen a more modest overall shift. Clearing the early-year lows in terms of bulls on the Advisory Services and Individual Investor surveys and the NAAIM exposure index would be evidence that investors have replaced optimism with fear. That is usually a necessary pre-condition for establishing a meaningful and lasting stock market low.
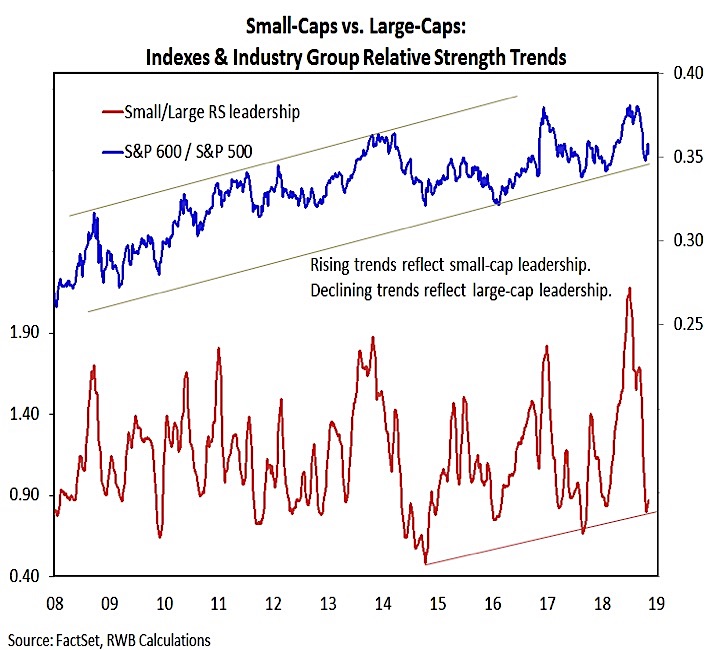
Seasonal Patterns have been upgraded to Neutral. In last month’s Investment Strategy Outlook (Strong Economy Covering Deteriorating Technicals), we discussed an improving seasonal backdrop but also noted October’s tendency to produce volatility. The historical influences that emerge at this point in the election cycle continue to argue for a seasonal tailwind into the middle of 2019. Nodding to this, we have upgraded Seasonal Patterns/Trends from Bearish to Neutral. To get all the way to Bullish, however, we would like to see evidence that historical tendencies are playing true to form. Beyond just the tendency for stocks to rally, we usually see resurgent small-cap leadership and a sector-level rotation away from Defensive groups. We are looking for evidence of either (or both) of these trends before completing the upgrade of the Seasonals.
Breadth has been downgraded to Bearish. Our breadth indicators have lagged the popular averages for much of 2018 and began to meaningfully deteriorate over the course of the summer. From one perspective, the U.S. found itself as an island of strength as stock markets around the world rolled over in early summer. From another perspective, new highs on the S&P 500 in September came as fewer industry groups were in up-trends and the number of stocks making new lows was expanding. Breadth indicators led the indexes lower in October. While a modest improvement is being seen during the initial rally off of the October lows, the damage done to the broad market reduces the likelihood that a sustained move higher can emerge without first seeing a period of testing and base-building.
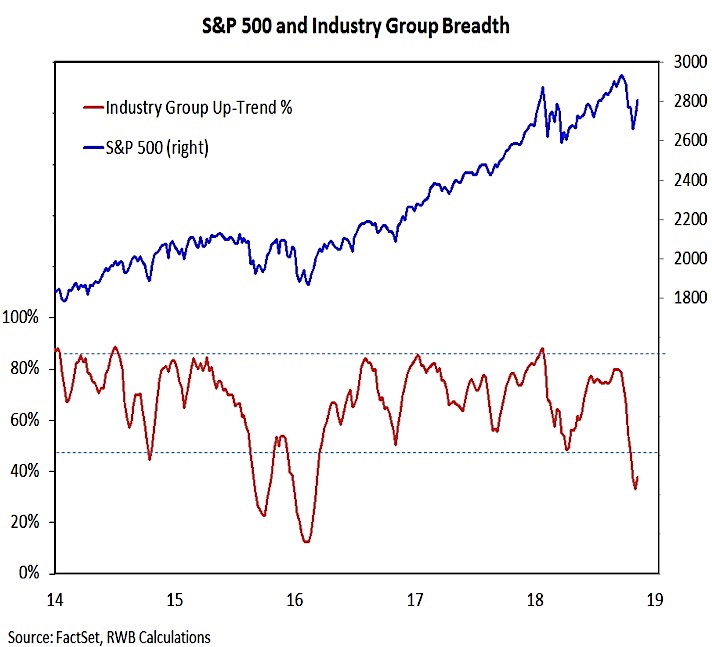
While it is not enough yet to suggest breadth has moved back to neutral, it is encouraging to see early evidence that we could be entering a period of base-building (as opposed to a pause that yields to significant further downside pressure). The move off of the late-October lows was strong enough to produce a breadth thrust based on the percentage of stocks trading above their 10-day averages. This is the first breadth thrust based on these criteria since February 2016. This does not preclude a meaningful re-test of the October lows (the batting average for this indicator is not much better than 50% until we get four-to-six months out). Once this period of testing and base-building is complete, we would expect to see breadth thrusts across multiple indicators, including several days where upside volume overwhelms downside volume by better than 10-to-1.
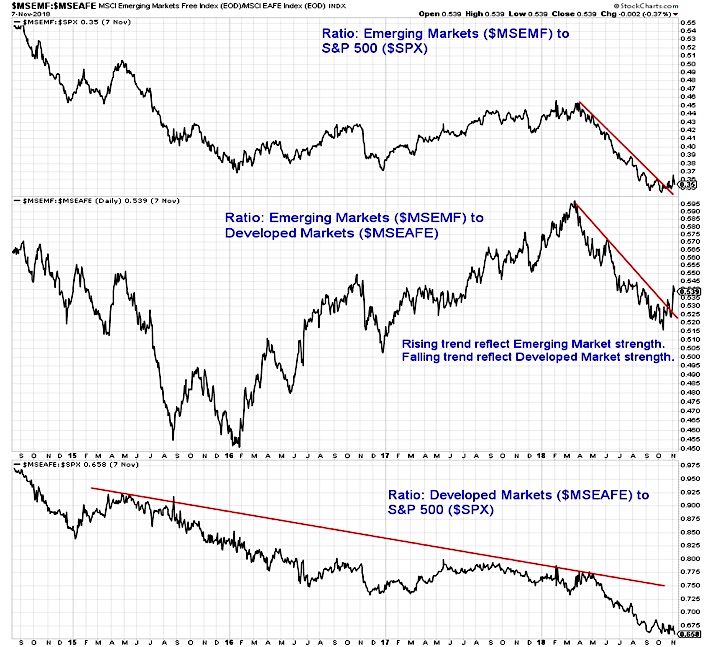
While evidence that a meaningful low has been made remains lacking, we may nonetheless see a leadership rotation among global stocks. Both emerging markets and developed international markets have spent much of 2018 in correction mode. The U.S. had been an isolated pocket of strength. With the damage done to the trend in October, the U.S. may now be in a position to catch down to its global counterparts (as they show evidence of stabilizing). After steadily losing ground versus the U.S. and developed overseas markets over the first nine months of 2018, emerging market may be seeing a shift in momentum and improving relative strength trends. Sustaining this preliminary strength would support the view that a more favorable global backdrop could be forthcoming as we move into and through 2019.
Twitter: @WillieDelwiche
Any opinions expressed herein are solely those of the author, and do not in any way represent the views or opinions of any other person or entity.


