The 4th quarter is off to a volatile start for U.S. equities investors.
A stock market correction in October has been countered by a strong rally into early November. So what will year-end bring?
Highlights:
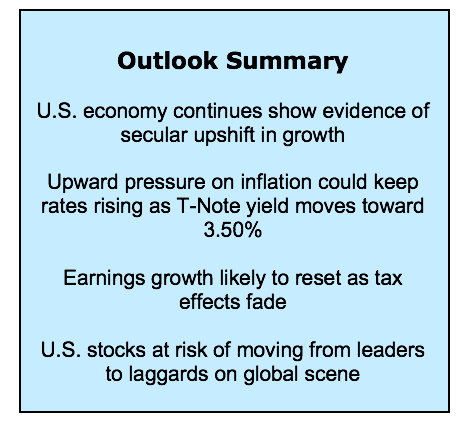
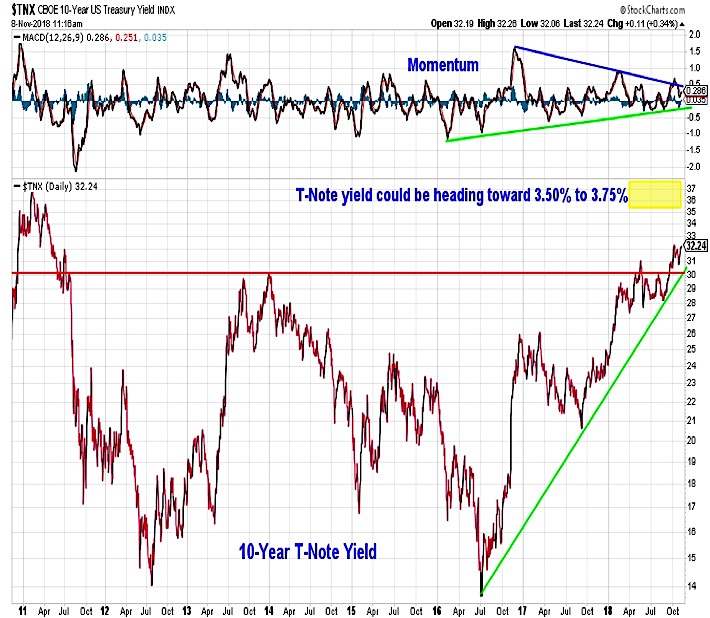
- Bond Yields Moving To Multi-Year Highs
- Economic Growth Surpassing Forecasts
- Earnings Growth Helping Valuation Re-Set
- Investors Not Showing Evidence Of Capitulating
- Small-Cap Leadership Key For Seasonal Strength
- Breadth Trends Deteriorate But Silver Lining Emerges
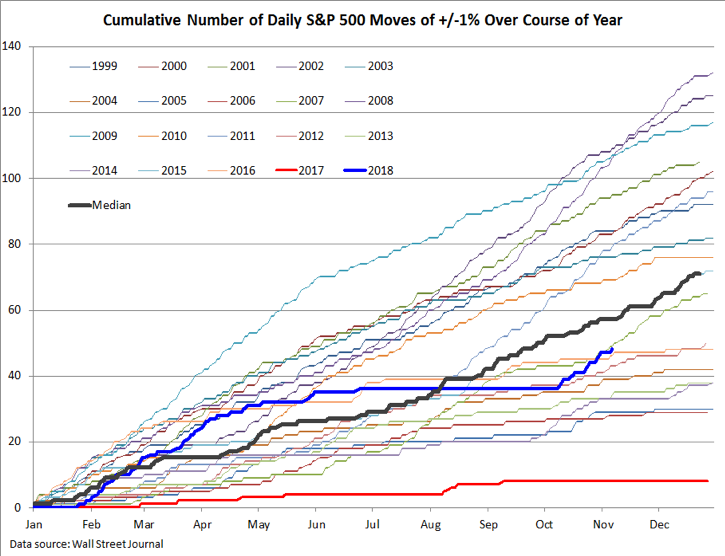
Volatility is returning to the stock market. After experiencing 36 daily moves in excess of 1% in the first half of 2018, an eerie calm emerged and the entire third quarter passed without a single daily move of 1% or more. This lasted until the second week of October, and since then there have been 12 daily moves in excess of 1% (including five that were greater than 2%, two of which were greater than 3%).
Overall, 48 trading days in 2018 have seen price swings on the S&P 500 of 1% or more, a sharp uptick from 2017 (which had a total of eight such moves) but still below the median experience of the past 20 years. It is important to remember that volatility begets volatility. The volatility that emerged as stocks weakened in October has persisted even as selling faded and stocks rallied off of their late-October lows.
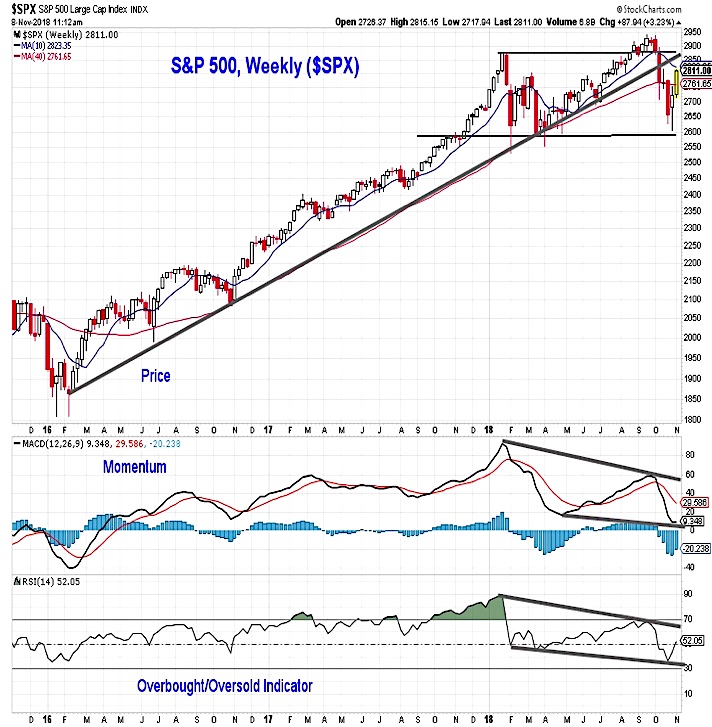
In addition to the risks that were already in place, October’s weakness produced meaningful trend deterioration on both a price and momentum basis for the S&P 500. From a price perspective, the October decline did something that was not experienced during the early-year sell-off – it broke the trend line that had provided support for the index over the course of the cyclical bull market that emerged off of the February-2016 lows. While selling faded as the index tested its early-2018 lows and the ensuing rally has recouped more than half of the loss, the damage to the price trend remains. One of the risks coming into October was the lack of momentum support for the new price highs seen in September. Now, momentum (and the overbought/oversold indicator) has made a lower low following a lower high, which is by definition a downtrend. The deterioration in price and momentum trends is consistent with the overall message of caution from the weight of the evidence.
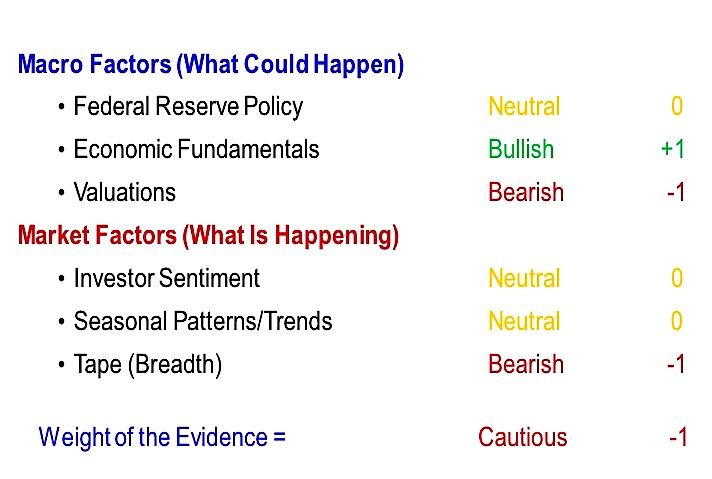
The overall weight of the evidence continues to argue for caution. The Macro Factors are unchanged this month. Rising interest rates could soon challenge the conclusion that Federal Reserve Policy remains Neutral. On the other hand, this year’s stock market volatility combined with surging earnings growth is contributing to an improving valuation picture (though stocks remain far from inexpensive at this juncture). The U.S. economy remains on firm footing. Changes, which we will detail below, can be seen in the Market Factors. Breadth has dropped to Bearish, while Seasonal Patterns have been upgraded from Bearish to Neutral. If history holds, this could soon get upgraded to Bullish.
Federal Reserve Policy remains Neutral. Despite the eight interest rate hikes already seen this cycle, the Fed Funds Rate is only now beginning to approach what many consider to be a neutral level. If the Fed goes ahead with the one more additional increase that is expected this year and follows it with the three additional increases that the Fed now sees as likely in 2019, Fed Policy could be on its way to being a headwind for stocks.
In both January and September of this year, sharp upticks in the 10-Year T-Note yield have contributed to volatility in the stock market. In contrast to previous years, yields have not pulled back much in the face of equity market weakness, and have been quick to recover once stocks stabilized. This supports our view that yields could continue to work higher, with the 3.50% to 3.75% range likely coming into play.
Economic Fundamentals remain Bullish. One reason that yields have been resilient in their march higher over the past two years is that economic growth has been steadily improving. While there are pockets of the economy (housing and autos come to mind) that are feeling the pinch of higher interest rates, overall growth continues to climb.
Yearly growth in Real GDP has climbed every quarter since mid-2016. It’s not shown on this chart, but actual yearly growth has been above forecasted yearly growth (based on the Survey of Professional Forecasters) for four quarters in a row. This has not happened in nearly two decades and is further evidence that the slow-growth regime where forecasts serve as a ceiling for growth is becoming a condition of the past.
continue reading on the next page…


