The stock market has been on fire of late, rallying up to the edge of price resistance on several indexes.
Today, we look at one of those stock market indexes: the Wilshire 5000.
The Wilshire 5000 tracks all of the stocks in the US market, so it is a broad based index that carries significant importance when gauging the health of the overall US stock market.
Looking at the long-term “weekly” chart below, it is pretty clear that the index is at an important price juncture.
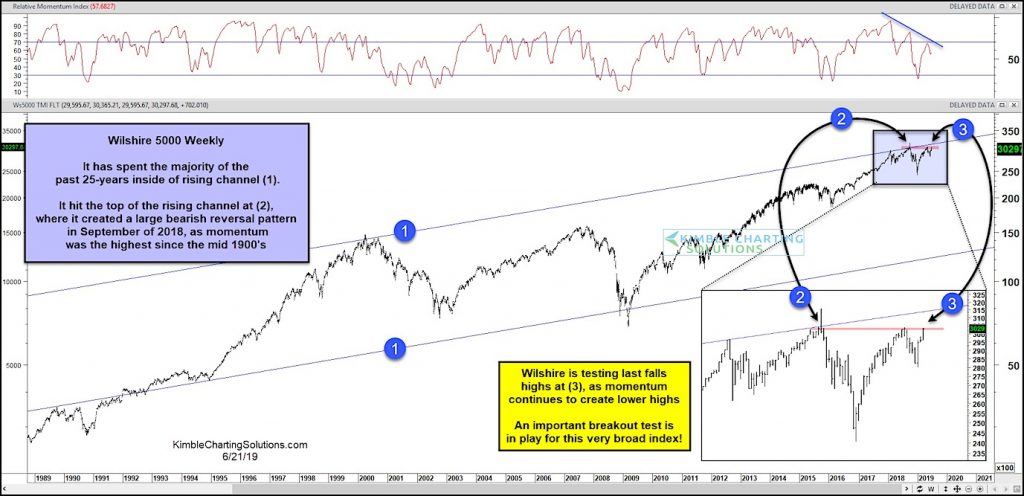
The Wilshire 5000 spent the last 25 years trading within a rising price channel (1). It tested the top of that price channel at (2) in September 2018, creating a large bearish reversal candle that lead to a steep decline.
This broad-based stock index tested last fall’s highs in May, before pulling back. It is once again testing last fall’s highs (and the May highs) at point (3). This comes at the same time that momentum is testing its downtrend line.
A very important breakout test is in play for the Wilshire at (3). Stay tuned!
Wilshire 5000 Index “weekly” Chart
Twitter: @KimbleCharting
Any opinions expressed herein are solely those of the author, and do not in any way represent the views or opinions of any other person or entity.
10:37 am CST June 24, 2019 – Editor’s note: This post was updated to correct the date of the last stock market high to September 2018 and to reflect that this is a “weekly” chart not a “monthly” chart.


