I started writing this piece on Thursday but didn’t finish it. It’s probably a good thing because it had a very different thesis than what I am about to write now. I took a look at the Wilshire 5000 ($WLSH) which is the broadest measure for US stocks and therefore provides a reliable gauge and wider picture for the state of the markets in general. Needless to say, the Wilshire 5000 bearish reversal that occurred Friday (and for the week) definitely changed the picture. And perhaps the trend.
But let’s start with a chart BEFORE Friday’s steep decline.
The weekly chart at Thursday’s close had a bullish bias for US stocks in the near term. Below is the weekly chart as of Thursday’s close followed by a quick excerpt from my original draft Thursday night.
Wilshire 5000 Index – Weekly Chart (before Friday’s bearish reversal)
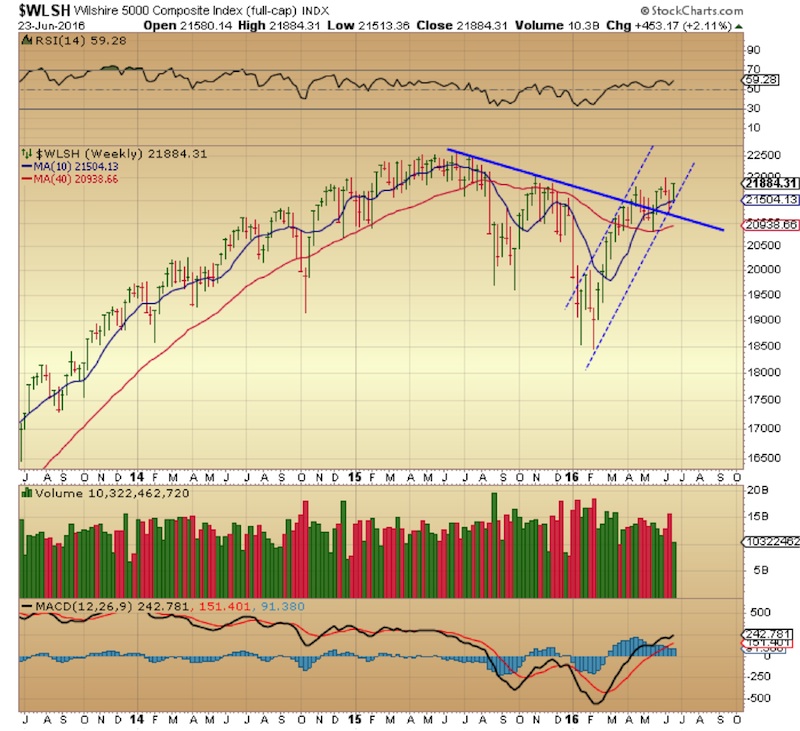
“Looking at the weekly chart, we see that we are basically still at the levels of Nov. 2014 although there have been some rather large swings in between. After reaching a top on June 22, 2015 the index began a gradual pullback that took it down 18.5% culminating in a low of 18,462 on Feb. 8 of this year.
Since then the index formed a rising channel within which price action waffled around the June downtrend line for six weeks until breaking out above it in a decisive manner on May 23rd. Since that break we’ve held above it and gone on to retest the lower end of the channel last week. This week, price regained and held the 10 week sma after bouncing right at the confluence between the 10wma and the lower end of that rising channel.
We are still firmly in bullish mode for now. There is plenty of support below starting with the lower rising trend line and the 10wma followed by the June down trend line. There is no reason to get bearish this market unless those levels start to give way.
Keep in mind that the Wilshire is a broad based index so there will always be room for larger moves within the confines of specific sectors. Speaking on a larger point of view, however, the path of least resistance for equities is still to the upside”.
The situation was pretty clear cut at Thursday’s close. Then came Brexit! I’m not going to get into the reasons behind Britain’s decision to leave the EU because I’m sure there is widespread exhaustion on the subject. There’s been plenty of minute to minute media coverage of the vote! But I will say that those levels of support that I had indicated in my original piece were indeed violated. And in a big way, changing the entire thesis of my post. This created a Wilshire 5000 bearish reversal pattern.
Below is a look at the updated weekly chart following Friday’s close. You can see the Wilshire 5000 bearish reversal clearly. That indicates caution over the coming days and a possible near-term trend change.
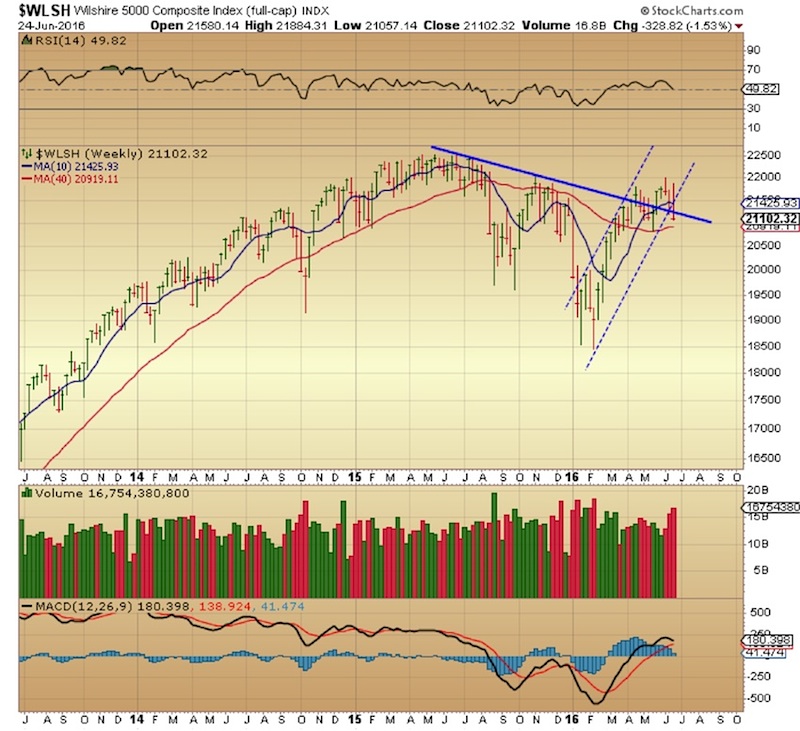
The situation clearly changed in a big way on Friday. First and foremost is the loss of the rising channel and the 10wma. That confluence of support is where buyers had stepped in on Thursday. The Wilshire 5000 also lost the June downtrend line! Like most stocks, it closed at the low of the day. All of this took place with a large spike in volume, giving some credence to the move. Clearly things have changed in the last 24 hours.
The index now has lots of work to do to regain the levels that supported further upside just the day before. This is why it’s so important to be flexible when it comes to markets. No matter how solid your thesis is/was, always keep in mind that things can turn on a dime and that the market can go against you very quickly, as it did on Friday. In these cases, you must be able to accept the new reality and quickly adapt to the new trend. Stubbornly insisting on your original plan even when price is clearly telling you that it’s no longer valid is a good way to blow up your trading account.
In the past, I have used sell offs caused by political turmoil to buy dips. When economic or financial matters are not involved in big down swings, I find it often presents a good opportunity to buy quality stocks at a cheap price, providing a chance to make money as they bounce back in the following days or weeks. It has worked for me many times and I thought this time would be no different.
Friday, however, turned out to be very different. The Wilshire 5000 bearish reversal created technical damage on the chart. As well, the reversal was backed up by a strong surge in volume. Furthermore, there was aggressive selling into the end of the day and we closed out the day and the week at the lows. This is normally very bearish and could signal continued pressure on markets for the next few days. Needless to say I wound up sitting on my hands on Friday.
It’s always better to wait for price action to confirm that the selling pressure has ended even if it means missing some upside. There will always be new set ups and opportunities to get involved and staying flexible and keeping an open mind can keep you out of trouble on days like Friday.
Thanks for reading.
Twitter: @DDCapitalFund
The author does not have a position in mentioned securities at the time of publication. Any opinions expressed herein are solely those of the author, and do not in any way represent the views or opinions of any other person or entity.


