Tuesday, the retail earnings report came out -0.8% lower than expected, amid recent highs in two of the major indices.
This caused the stock market to gap lower followed by a continued selloff throughout the day.
However, the stock market did not close at the lows of the day which could be seen as a dip-buying opportunity for tomorrow.
While that may be the case, there are specific price levels the market needs hold if we are to expect a bounce on Wednesday. We should also stay cautious as there are new underlying fears caused by the retail earnings report.
Why the Retail Report is Making Investors Worried
Lower retail sales can be contributed to not only supply chain disruptions, but rising inflation as the cost of goods and the scarcity of them has put extra stress on economic growth.
Stemming from the pandemic this issue along with inflation was set to be transitory in the eyes of the Fed.
Additionally, the Fed thought that Covid-19 cases would continue to decrease as the vaccinated population grew.
This means they could keep their goals of phasing out support programs and increasing interest rates by 2022-2023.
However, now that the delta variant is stretching out the pandemic timeline, the market could be looking for signs of continued support or acknowledgment that the Feds plan needs to adapt.
With that said, this issue will become clearer as time and more reports are released.
On the other hand, short-term market action is more volatile and can fluctuate based on more than just the long-term picture.
Should we Expect a Stock Market Bounce?
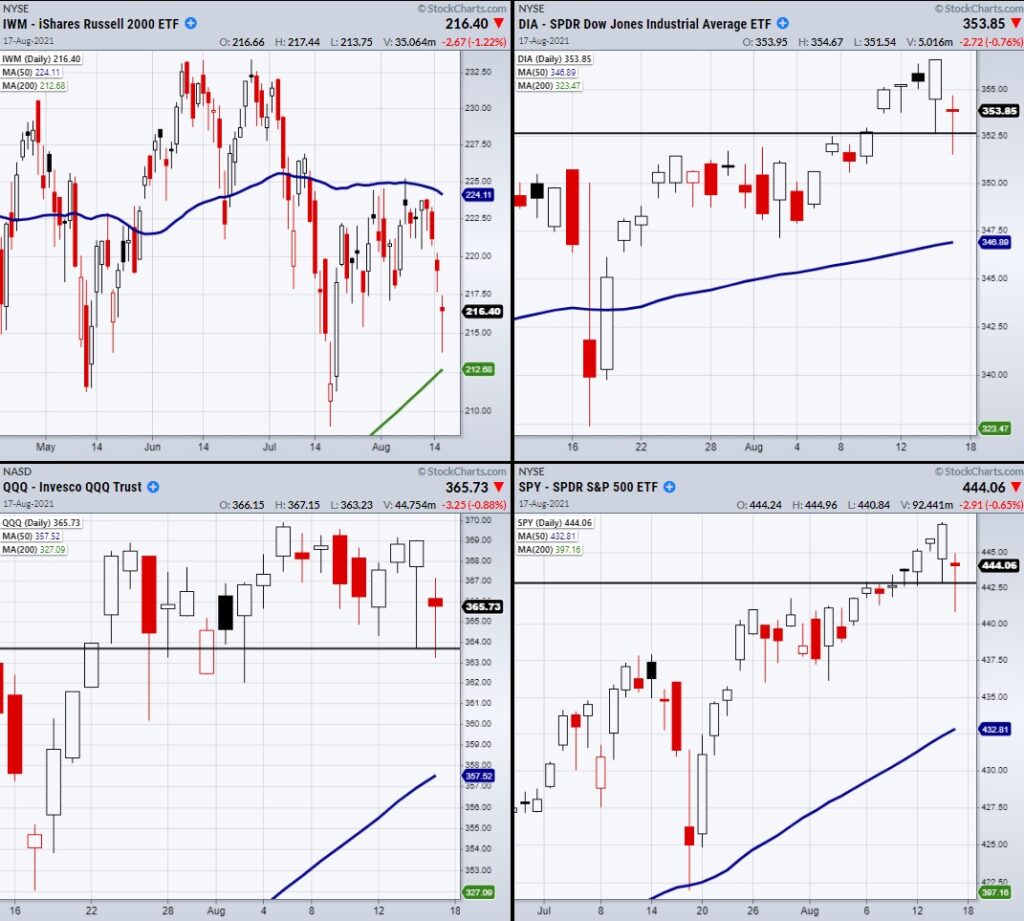
Only if the major indices respect specific price levels.
This is especially true for the Small-cap index Russell 2000 (IWM), which has been rangebound for most of the year.
Currently, IWM has pulled back from the lower end of its range near the 200-Day moving average. The large lower wick on Tuesday’s candle shows there is support in this area. Therefore, if IWM holds over the 200-DMA at $213.19, we can expect dip buyers to be looking for an entry.
The other indices including the S&P 500 (SPY), Dow Jones (DIA), and the Nasdaq 100 (QQQ), don’t have as clear of a support level.
Their redeeming factor is that they did not confirm a topping chart pattern with a close under Monday’s low.
So, if the market does bounce, they should stay over Mondays low as seen in the above chart.
However, if Monday’s lows cannot hold, stay cautious as dip/bounce buyers don’t like to be caught holding a falling knife.
Stock Market ETFs Trading Analysis & Summary:
S&P 500 (SPY) Closed over the 10-DMA at 443.39
Russell 2000 (IWM) support the 200-DMA at 213.19
Dow (DIA) 351 support.
Nasdaq (QQQ) 362 support.
KRE (Regional Banks) 64.86 pivotal.
SMH (Semiconductors) Needs to get back over 257.06 the 50-DMA.
IYT (Transportation) Resistance 257.68.
IBB (Biotechnology) Support area the 50-DMA at 164.29
XRT (Retail) 92.35 next support. 98 resistance.
Twitter: @marketminute
The author may have a position in mentioned securities at the time of publication. Any opinions expressed herein are solely those of the author and do not represent the views or opinions of any other person or entity.


