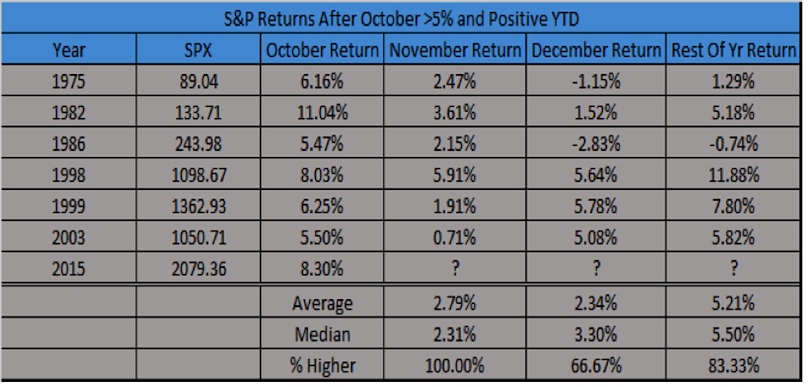
At Kimble Charting Solutions we’ve coined a new indicator called the ‘October Indicator’. It says, as goes October goes the rest of the year. As you can see below, going back 40 years, when October is up 5% and the calendar year is positive – November has never been lower and the rest of the year gains another 5% on average. Not bad. Could that mean higher prices for stocks?
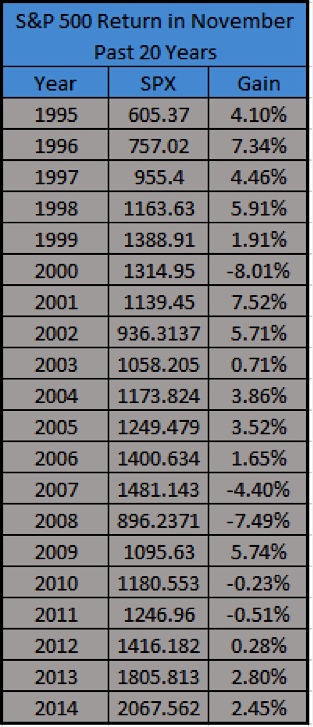
Lastly, November saw stocks gain 2 percent in each of the past two years. But the stock market hasn’t gained 2% three consecutive years in November since the mid-‘90s.
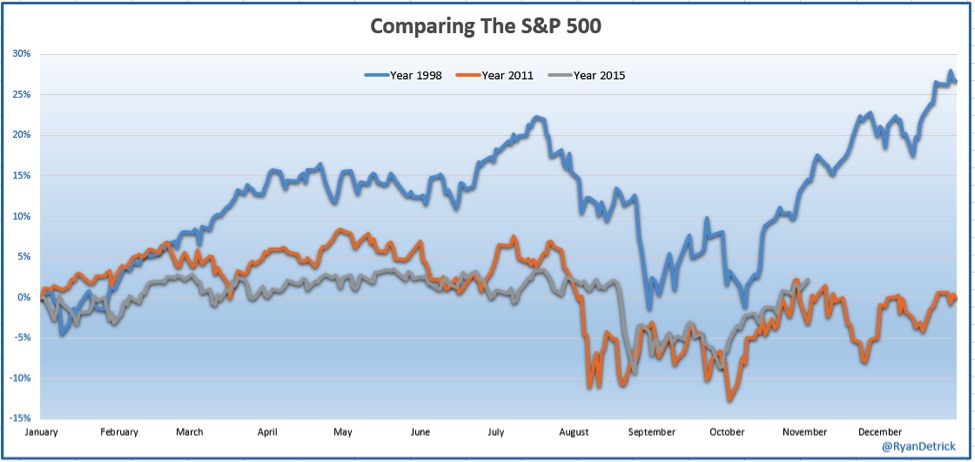
In conclusion, stock market seasonality continues to favor the bulls. Let’s leave on this chart. 2011 and 1998 look very similar to 2015. 2011 peaked right about now, while 1998 gained another 10%. I think we do finish higher than we are right now, but can we really gain another 10 percent?
Thanks for reading and good luck out there.
Twitter: @RyanDetrick
Author has a long position in S&P 500 related securities at the time of publication. Any opinions expressed herein are solely those of the author, and do not in any way represent the views or opinions of any other person or entity.

: Showing Some Signs of Emerging Strength")

