Welcome to November. After the best month in four years and the 6th best October ever for the S&P 500, the big question is what happens next? I’ve been in the bull camp and continue to think this rally could have legs. Especially if November market seasonality remains true to form.
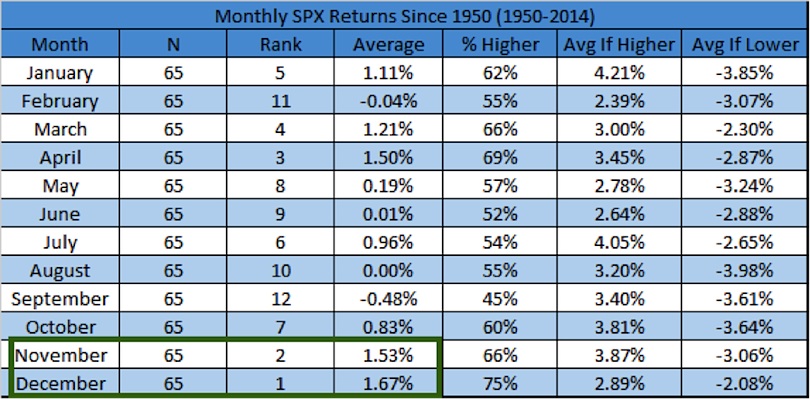
First up, the next two months are the top two performing months going back to 1950.
Think about that for a minute. As you know, there’s no guarantees with investing, but that’s pretty bullish.
Here’s what the monthly S&P 500 returns look like since 1950:
S&P 500 Monthly Returns Since 1950
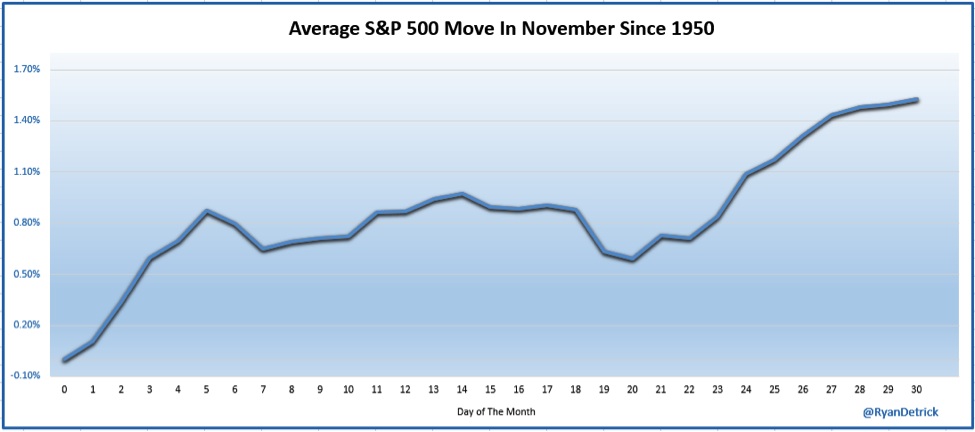
Here’s what the average November market seasonality (i.e. performance) has looked like since 1950. Really strong to start the month, then a lull before a late month surge.
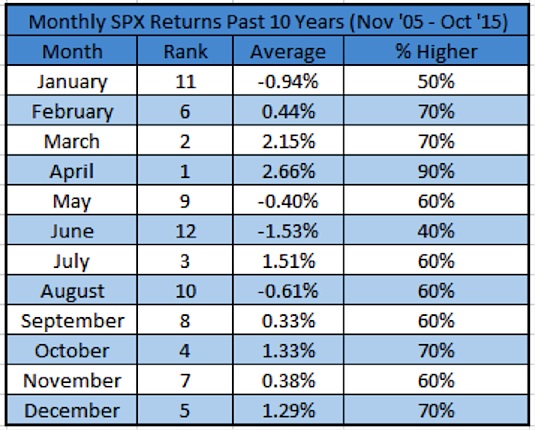
Here’s where things get fun: Over the past 10 years November market seasonality hasn’t been very strong – coming in right about the middle of the pack.
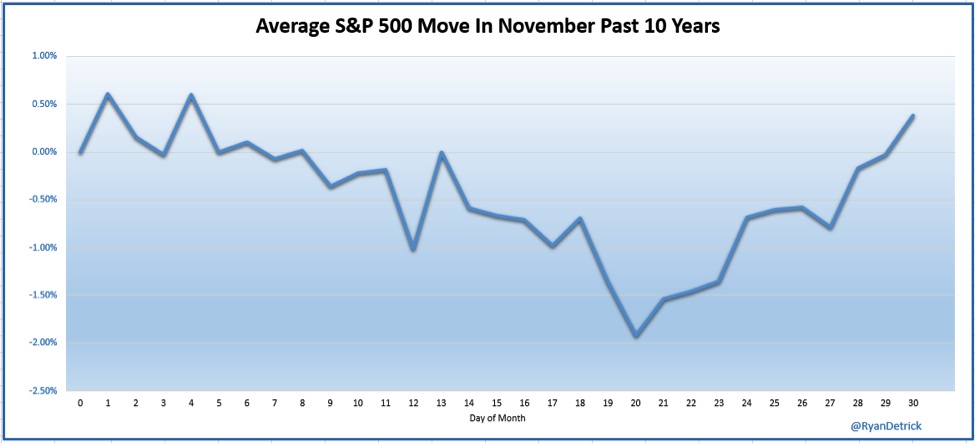
The past 10 years, November tends to be weak right out of the gate for stocks – until a late bounce.
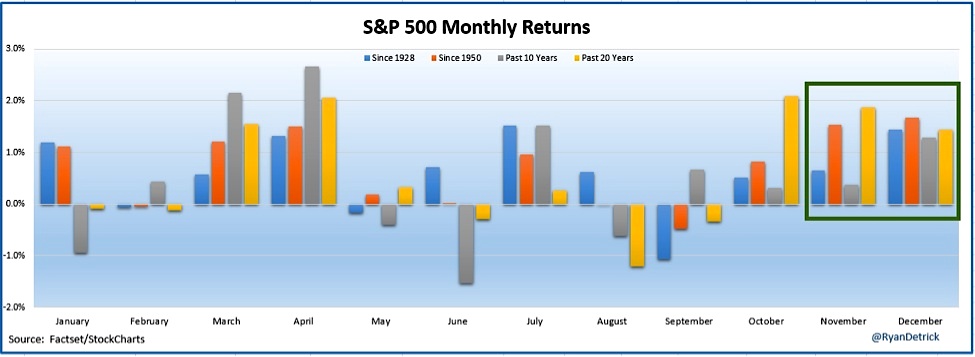
Here’s a chart summing up monthly returns on various timeframes. Bottom line here is that end of year strength for the stock market is quite common.
continue reading on the next page…


