There has been a lot of talk in recent months about waning momentum and a long-term topping process taking place in the stock market.
Do the facts support this bearish hypothesis?
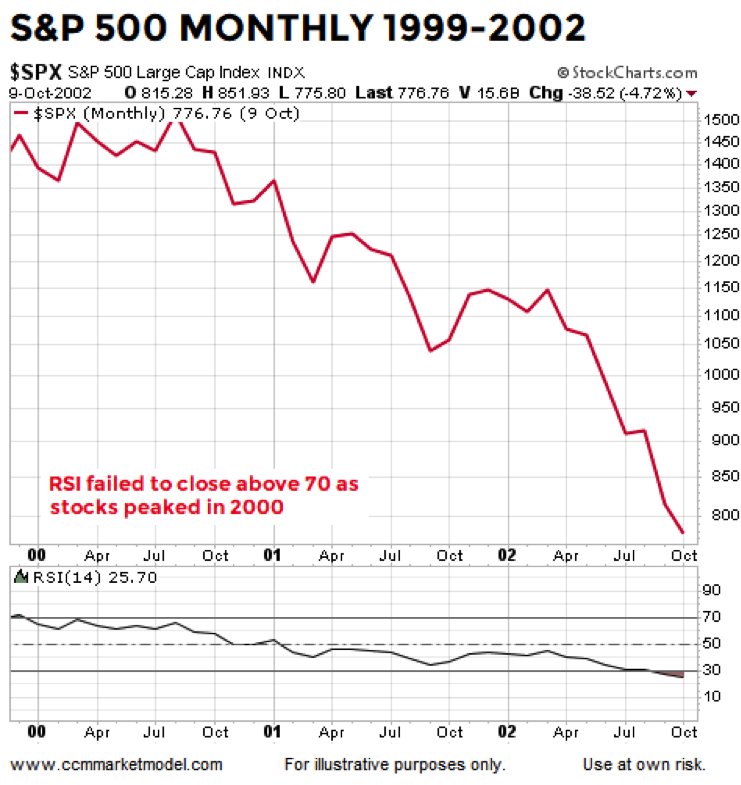
2000-02 BEAR MARKET
In late 1999, several months before the S&P 500 Index (INDEXCBOE:.INX) peaked, monthly RSI dropped below 70, which was a sign of waning momentum. Monthly RSI never recaptured 70 during the entire 2000-02 bear market.
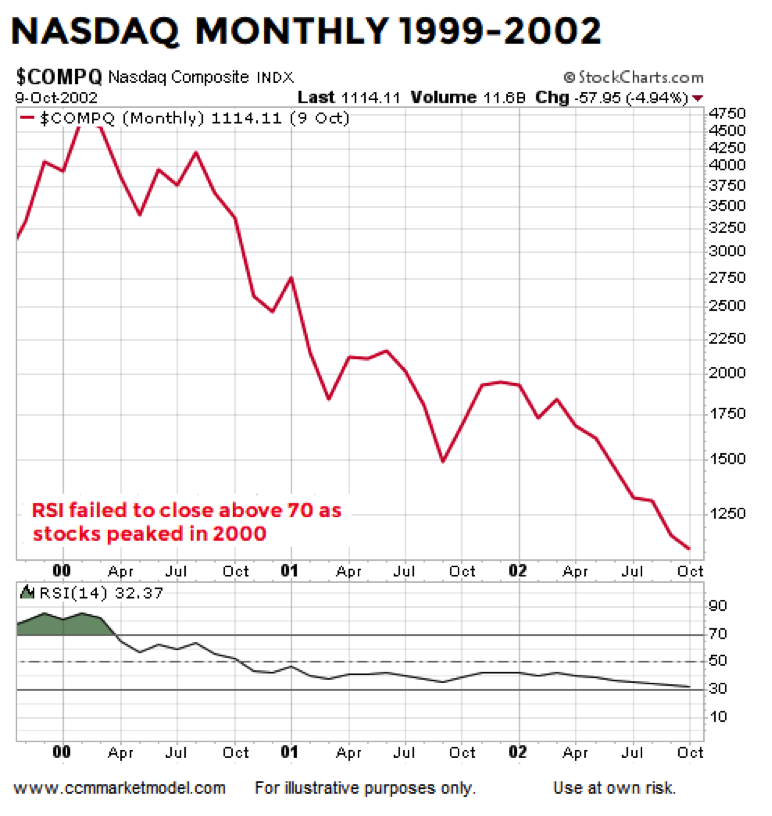
Similar situation with the NASDAQ Composite (INDEXNASDAQ:.IXIC) during the 2000 peaking process; RSI dropped below 70 soon after the March 2000 peak and never recaptured 70 for the entire bear market.
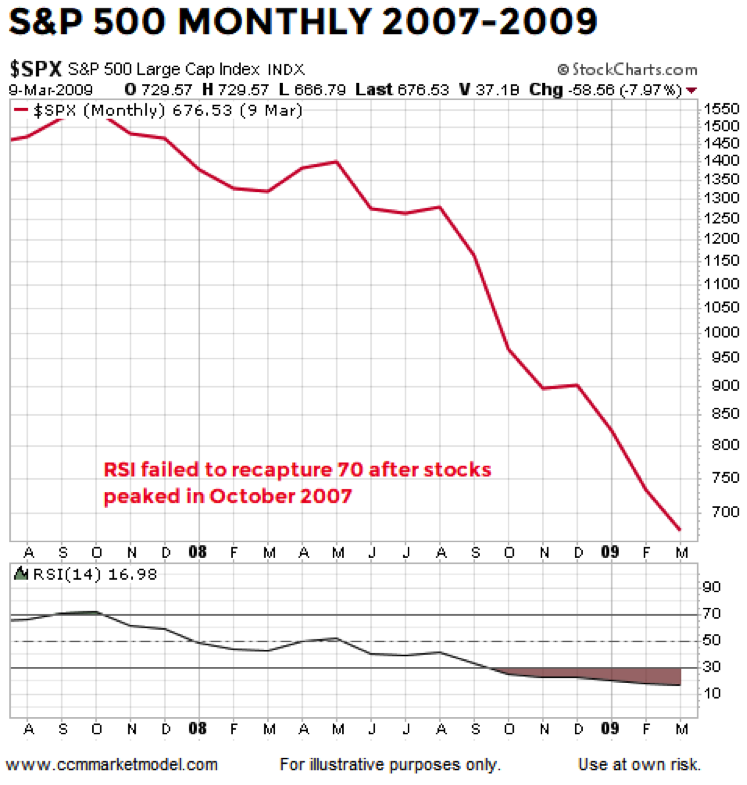
2007-09 BEAR MARKET
After the S&P 500 peaked in October 2007, monthly RSI never recaptured 70, which was a sign of waning bullish momentum. Monthly RSI remained below 70 for the entire 2007-09 bear market.
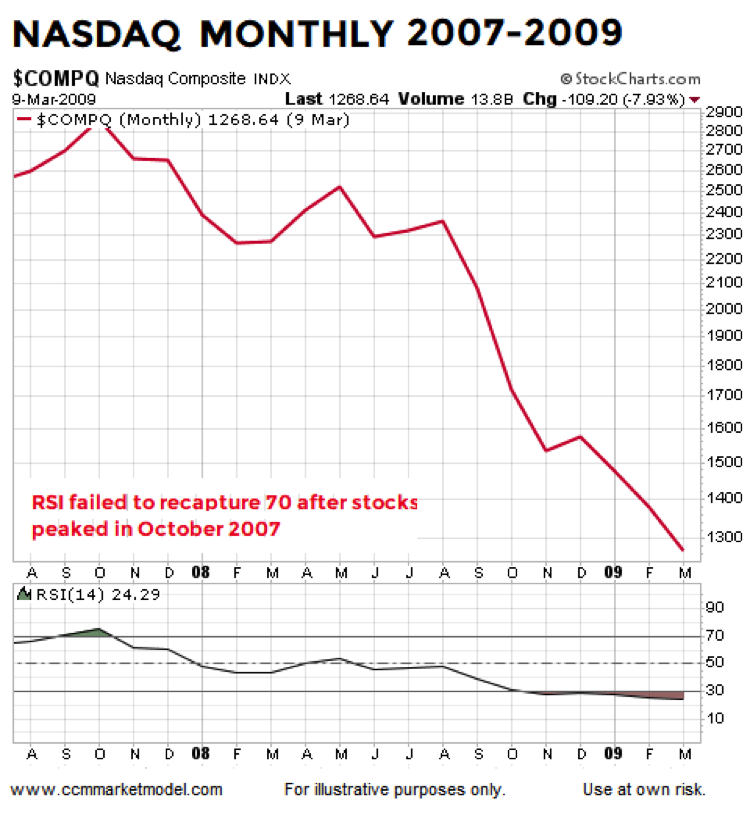
Similar situation with the NASDAQ, monthly RSI dropped below 70 soon after the October 2007 peak and never recaptured 70 during the entire bear market.
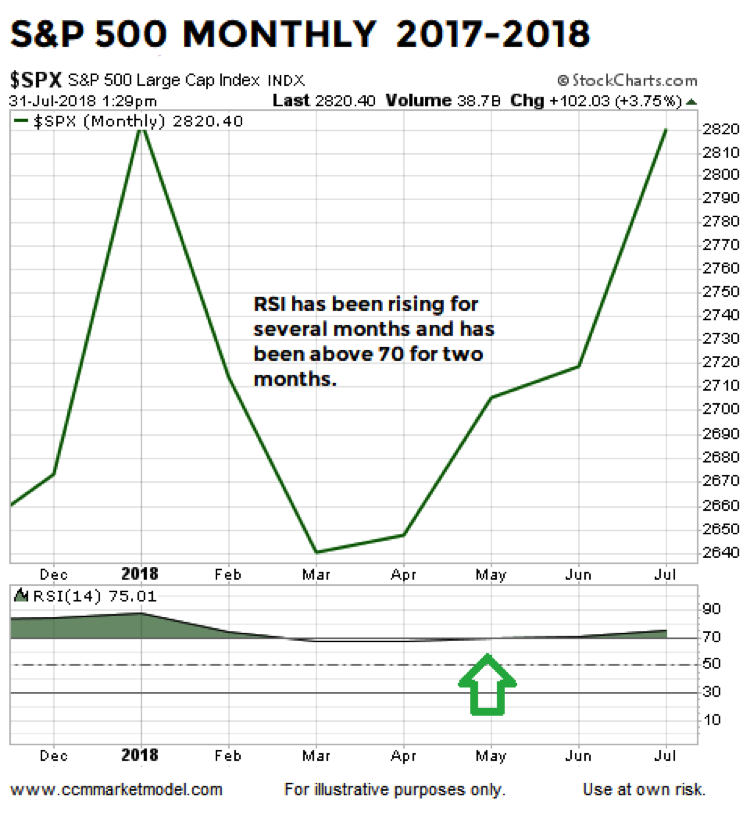
MAY 2018: MONTHLY RSI RECAPTURES 70
Unlike the 2000-02 and 2007-09 periods shown above, monthly RSI for the S&P 500 closed back above 70 on May 31, 2018 and remains above 70 on July 31, 2018.
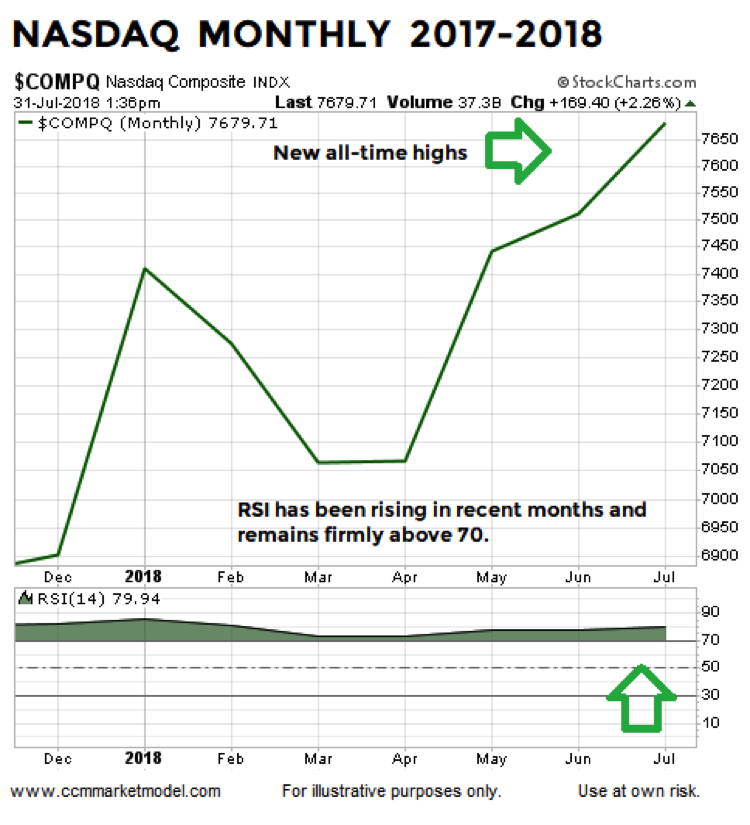
If long-term momentum in the tech-heavy NASDAQ was waning, we would expect to see it reflected in monthly RSI just as it was in 2000 and 2007. The 2018 stock market chart, from a long-term momentum perspective, looks nothing like the waning-momentum looks in 2000 and 2007. In fact, RSI has not dropped below 70 at any point during the corrective process in calendar year 2018, which is indicative of strong bullish momentum.
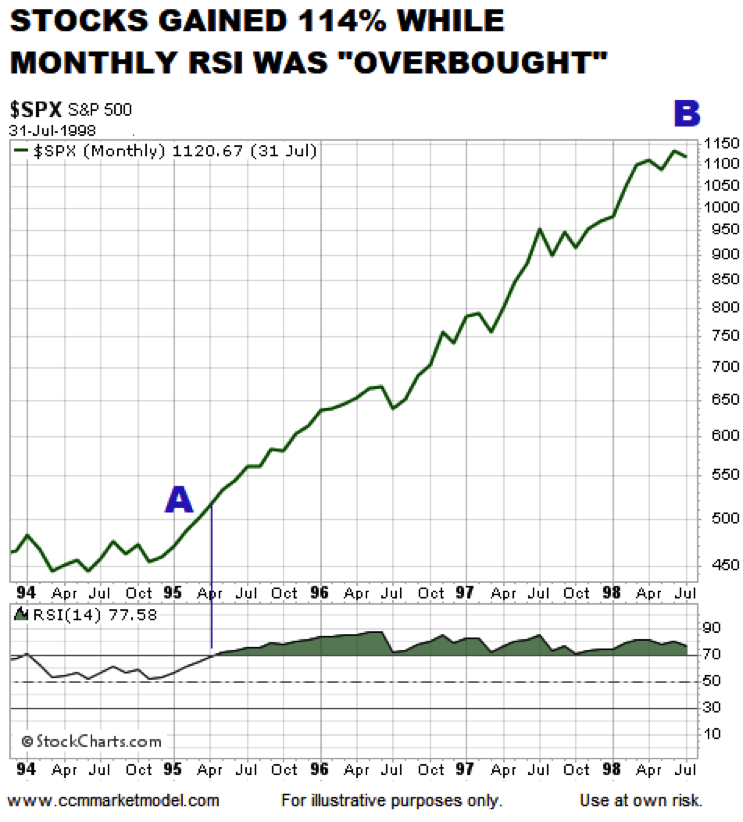
“OVERBOUGHT” IS NOT BEARISH
As shown via the 1994-98 example below, during strong trends markets can remain “overbought” for long periods of time.
We have highlighted similarities between 2016-18 and 1994-96 numerous times, including in December 2016.
A March 2017 analysis provides numerous examples of bullish periods that were marked by “overbought” readings.
CONCEPTS COVERED IN EARLY JUNE
Constructive momentum told us to remain open to better than expected outcomes in a June article. Long-term momentum remains strong today and is sending the same constructive message.
Twitter: @CiovaccoCapital
The author or his clients may hold positions in mentioned securities at the time of publication. Any opinions expressed herein are solely those of the author, and do not in any way represent the views or opinions of any other person or entity.
")


")
