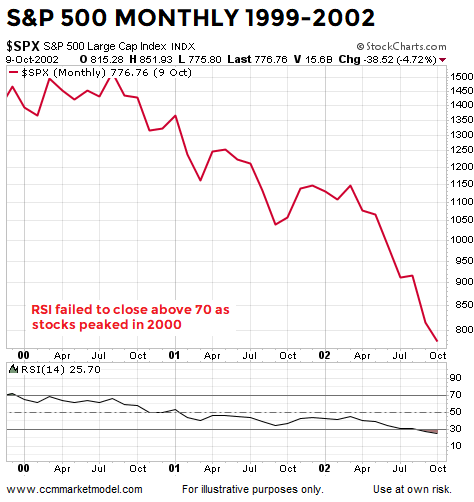
2000-02 BEAR MARKET
In late 1999, several months before the S&P 500 peaked, monthly RSI dropped below 70, which was a sign of waning momentum. Monthly RSI never recaptured 70 during the entire 2000-02 bear market.
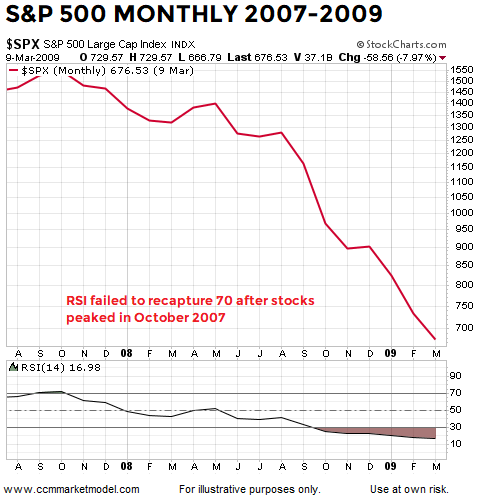
2007-09 BEAR MARKET
After the S&P 500 peaked in October 2007, monthly RSI never recaptured 70, which was a sign of waning bullish momentum. Monthly RSI remained below 70 for the entire 2007-09 bear market.
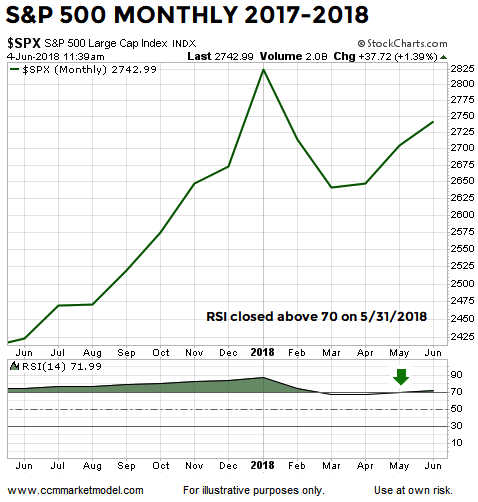
MAY 2018: MONTHLY RSI RECAPTURES 70
Unlike the 2000-02 and 2007-09 periods shown above, monthly RSI closed back above 70 on May 31, 2018 and remains above 70 today.
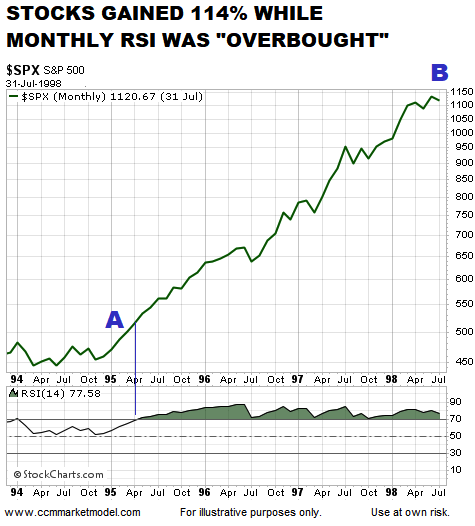
“OVERBOUGHT” IS NOT BEARISH
As shown via the 1994-98 example below, during strong trends markets can remain “overbought” for long periods of time. We have highlighted similarities between 2016-18 and 1994-96 numerous times, including in December 2016. A March 2017 analysis provides numerous examples of bullish periods that were marked by “overbought” readings.
ANOTHER “THIS NEVER OCCURRED” SIGHTING ON THE NASDAQ’S MONTHLY CHART
This week’s stock market video covers a separate important development that went into the books at the end of May 2018. The video also provides a detailed comparison between 2018 and the period in late 2015/early 2016 that featured a false breakout, reversal, and lower low.
MORAL OF THE STORY
The charts assist us in assessing the probability of good things happening relative to the probability of bad things happening. Given what we know today, the probability of good things happening is quite a bit more favorable than it was in early 2000 and late 2007.
Twitter: @CiovaccoCapital
The author or his clients may hold positions in mentioned securities at the time of publication. Any opinions expressed herein are solely those of the author, and do not in any way represent the views or opinions of any other person or entity.


: Showing Some Signs of Emerging Strength")
