The past several weeks have seen Silver prices consolidate in a wide range. This range indicates a still indecisive market for precious metals. However, that doesn’t mean that there aren’t opportunities for traders. The iShares Silver Trust ETF (SLV) captures a nice potential trading setup for SLV in the weeks ahead.
But before we look at the technical setup for Silver, let’s briefly cover some fundamentals.
The Fundamental Backdrop For Silver
Caught in a multi-year bear market, precious metals are still having trouble finding a bottom. That is likely due to three major fundamental forces:
- A Stronger U.S. Dollar
- A possible Fed Rate Hike
- Asset class allocation – Equities and Bonds are still in favor
BUT, at the same time, this is where I see an opportunity over the short-term. Two of the hurdles have been temporarily removed, as the US Dollar has pulled back and expectations for a Fed rate hike have been put off. Stocks are a wild card this month. They are still hovering near all-time highs, but “Sell In May” could bring some volatility before month-end.
That said, this is potential short-term setup. Precious metals remain in a macro downtrend and any rally would likely be counter-trend (corrective) in nature.
Technical Analysis
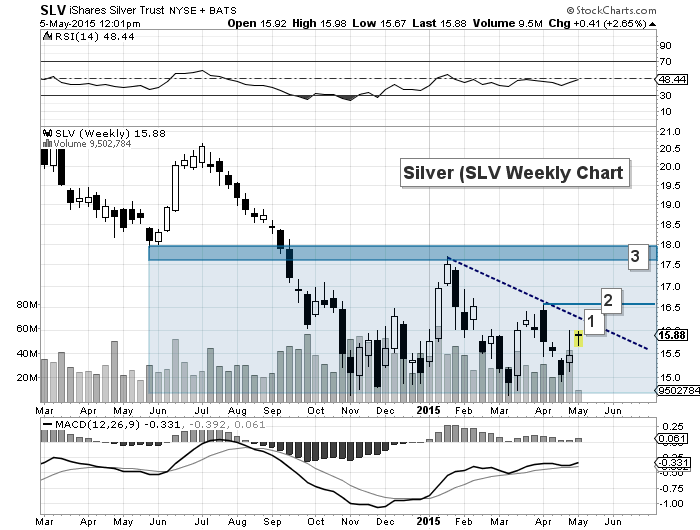
Let’s start with the weekly chart. As you can see, the Silver ETF (SLV) has consolidated in a broad range. This has formed a base of sorts, and at a minimum, traders have the lower part of the box to trade against. If SLV can get through its first technical resistance (labeled 1), it should target a retest of the early April highs of 16.57 (labeled 2). Note this is also near its 200 day moving average (see daily chart further down). This area also marks the December highs.
A move above the April highs would setup for a retest of the January highs. 17.50 to 18.00 is stiff resistance.
Silver (SLV) Weekly Chart
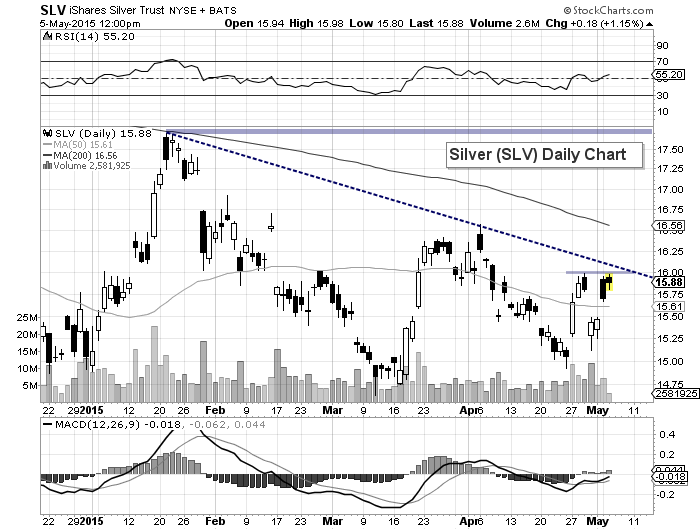
Zooming in on the daily chart gives traders a look at the near-term behavior of Silver (SLV). As you can see, SLV had 2 positive candles (white with stems) on Thursday and Friday, and gapped higher on Monday. This creates the potential for an island reversal and hints at buying pressure. SLV is back at last weeks highs and will need to get through its near-term downtrend resistance line. There are no guarantees, but the two “tails” (stems) from last week gives it a good shot.
Silver (SLV) Daily Chart
Note that fellow SIM contributors Kurt Hulse and Tom Pizutti shared an Elliott Wave analysis for Silver and its ETF (SLV) and this account seems to align well with the traditional technical analysis that follows.
Thanks for reading.
Twitter: @andrewnyquist
Author has a position in SLV at the time of publication. Any opinions expressed herein are solely those of the author, and do not in any way represent the views or opinions of any other person or entity.

: Showing Some Signs of Emerging Strength")

