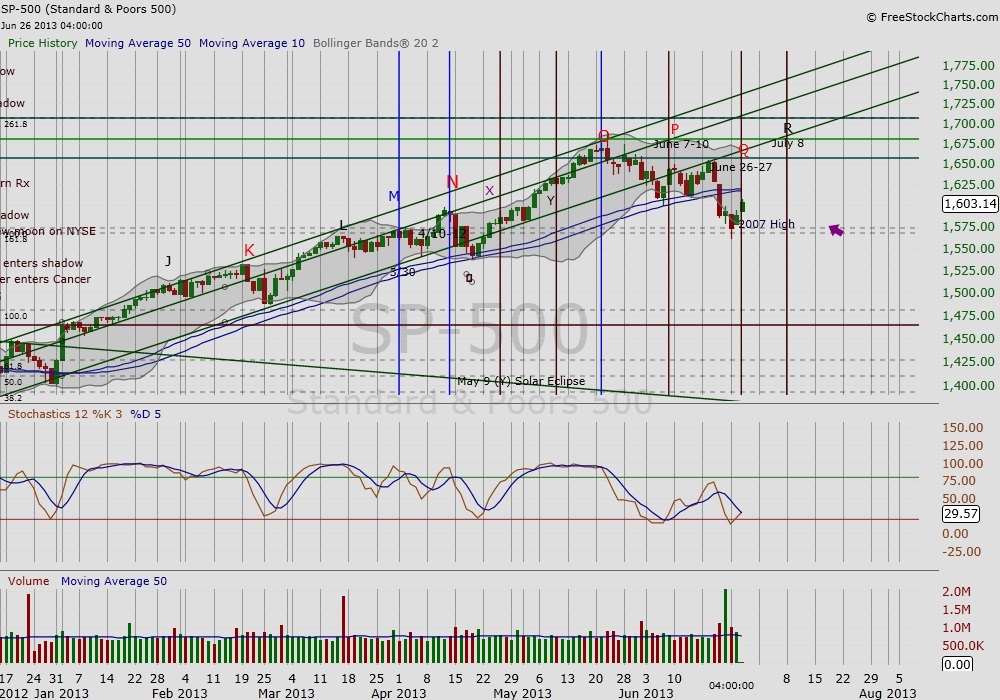
 This is follow-up to our continuing study of planetary stations and major planetary aspects against the market. It is now more than a month since the Pluto-Uranus square (at O), and what has proven to be “Turn-around Tuesday,” as noted in Andy Nyquist’s May article. Marked in the chart below, June 26-27, are the next dates to watch in our time price analysis study with the arrival of Mercury retrograde and Jupiter ingress into Cancer. From a price perspective, the S&P 500 (SPX) may just be finding support at the 2007 high for another rally attempt.
The SPX first broke thru the 2007 high and resistance this April, but soon the market went into a short term pull-back following the Pluto station in April. The final leg between the Pluto station and the Pluto-Uranus square saw some high flyers, e.g. Green Mountain Coffee (GMCR) and Tesla Motors (TSLA) making the news and most assuredly helped to create the growing interest by mom and pop in the seven months-long rally. News out of Asia dampened some of this exuberance and on June 11, the SPX suffered a seventh distribution day. For those who follow IBD method of identifying market weakness via distribution (sign of professional selling), the seventh distribution day resulted in IBD changing the market outlook to “market in correction” (1).
Mercury Retrograde
The Mercury retrograde cycle began when Mercury entered its Shadow June 10. The following day, as mentioned above, the SPX suffered a seventh distribution day. Mercury in astrology rules communication; and the retrograde is known to create some miscommunication or other snafus in this area, so I chalk up the change from “market in correction” to “market in an uptrend” without what I could determine as proper follow-thru as just one of those Mercury retrograde moments. Mercury retrograde is best used to review, revisit, research, etc. New information may not always be clear during the retrograde. The last Mercury Retrograde dates fell during 2012 Presidential Elections and the Cyprus banking drama this February. Following the Mercury station direct last August, the SPX broke the April 2012 high and began the fall 2012 uptrend.
Time Price Analysis: “Sell in May” and Summertime
As we’ve seen in past seasons, summer holiday and a general disinterest in the daily movements of the market, we might expect side-ways action and further consolidation of recent high flyers and new emerging bases. On June 24, the SPX formed a hammer (long bottom wick) into the 2007 high. Note the volume the previous trading day that failed to push the market below this support level. While it is technically too early to call the hammer as a low without a proper market follow-thru, given price action and time perspective, it might not be too early to “revisit” some recent breakouts that failed in recent past that may just try again. Yes, time price analysis may be proving to be important again.
S&P 500 Time Price Analysis Chart
Revisiting the Transports
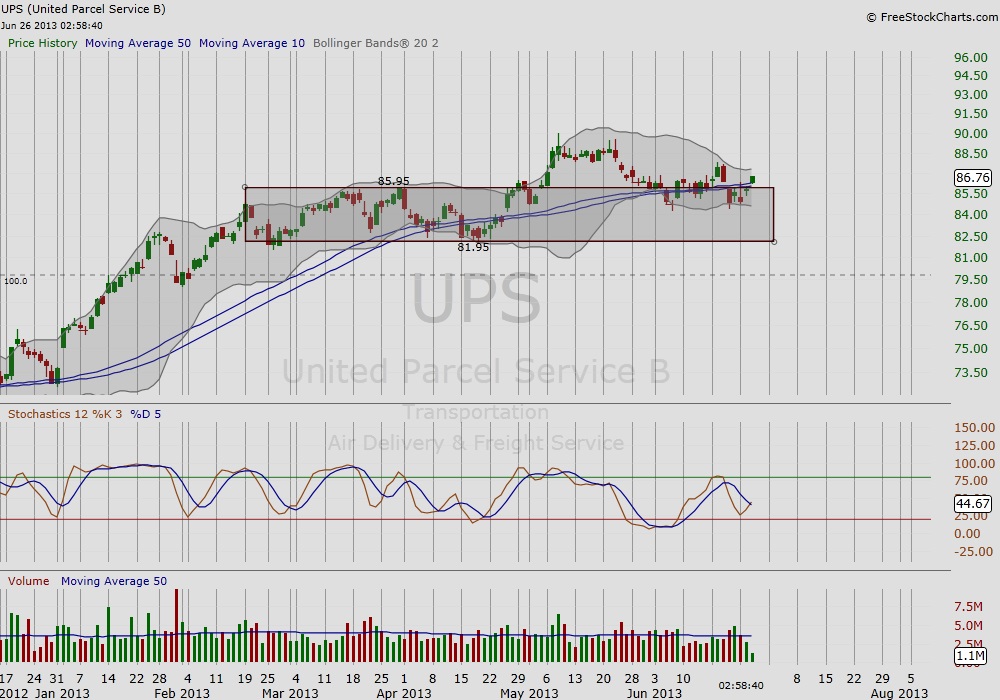
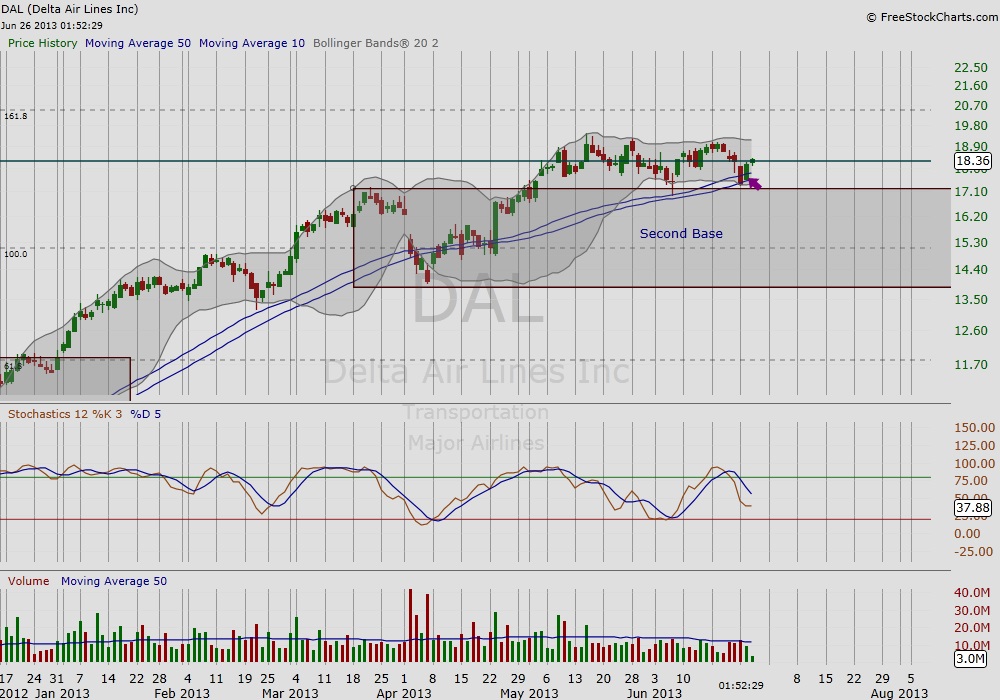
In our May article, we highlighted some transport names that were base building. Market weakness in late May saw some initial attempts to breakout from weekly bases fail. The SPX finding a potential floor at the 2007 high might be an opportunity for those that failed to try again. Below are the charts of UPS and DAL. Both are currently finding support at their 10/50 day ma and the top of the last base.
UPS Time Price Analysis Stock Chart
DAL Time Price Analysis Stock Chart
Thank you for reading. Hope you are enjoying summer and see you next time.
Reference
- Arancibia, Juan Carlos (June 11, 2013). “Global Stock Sell-Off Spreads to Wall Street” found at https://news.investors.com/investing-the-big-picture/061113-659659-global-stock-sell-off-spreads-to-wall-street.htm.
- Stock charts from FreeStockCharts.com
No position in any of the mentioned securities at the time of publication.
Twitter: @RinehartMaria and @seeitmarket
Please check us out on Alexa and feel free to provide a review with feedback.

: Showing Some Signs of Emerging Strength")
