Last week I tweeted:
I believe the #commodities prices in food softs $DBA have bottomed. $GLD – well those who know me-that I pointed out bottomed months ago. $SLV now outperforming. That tells you something. Maybe even #oil. Get ready for the Commodities Super Cycle.
If you are not following me @marketminute on twitter-you should consider doing so as I often make such comments or point out specific trades.
Technically, the charts were already setting up for a buy in the individual grains. We decided to focus on DBA.
Fundamentally, we have geopolitical issues as we know. I also talk about sugar-still rocketing in price, a lot.
Now weather is becoming an additional factor.
I read today that Russia is refusing to sell wheat below $275 a ton, which combined with failing HRW wheat in the plains and Southwest US and heavy snowpack in the northern plains, means supply could get even tighter.
DBA tracks an index of 10 agricultural commodity futures contracts. It selects contracts based on the shape of the futures curve to minimize contango.
Specifically, the underlying index includes corn, soybeans, wheat, Kansas City wheat, sugar, cocoa, coffee, cotton, live cattle, feeder cattle, and lean hogs. And there is a K-1 to investors.
Basically, you get great exposure to lots of commodities.
Technical Analysis:
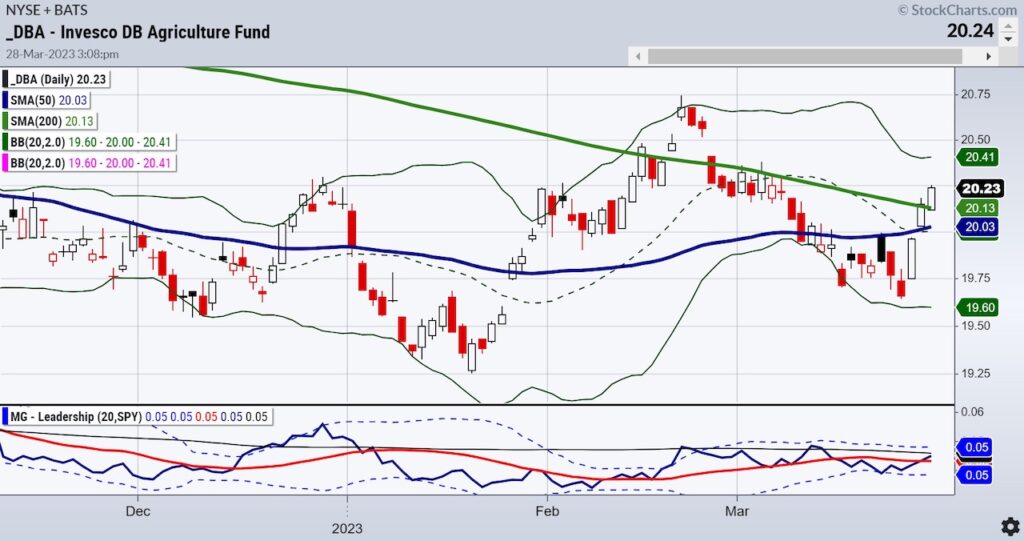
The first chart shows the Triple Play Leadership indicator or how DBA is performing against the benchmark.
The price chart of DBA shows the 200-DMA above the 50-DMA or an accumulation phase according to our six market phases.
Tuesday, the price cleared the 200-DMA, closing .40% higher.
On the Leadership charts, DBA poke its head out above the benchmark to show it is now outperforming the SPY.
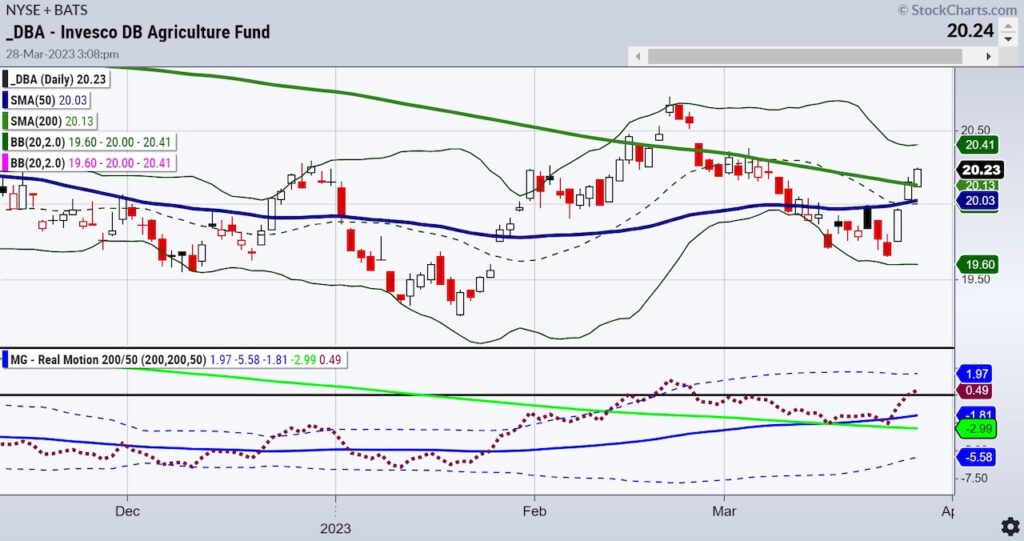
The second chart (above) shows our Real Motion Indicator or momentum.
Here’s where things get real interesting.
The 50-DMA is ABOVE the 200-DMA. Momentum is in a bullish phase.
Furthermore, the red-dotted line or measure of momentum cleared both MAs and the black horizontal line or zero point.
Bullish momentum and a divergence with the price chart showing the 50-DMA below the 200-DMA.
What does this all mean?
Seasonally, we are entering the make-or-break time for crops.
Inflation wise, food prices continue to escalate. In the U.K. grocery inflation rose again in March to a record 17.5%
Full Disclaimer: We have a position in $DBA.
Stock Market ETFs Trading Analysis & Summary:
S&P 500 (SPY) Needs to clear 400 and hold 390
Russell 2000 (IWM) 170 held- 180 resistance
Dow (DIA) 325 could not hold-pivotal
Nasdaq (QQQ) 305 support 320 resistance
Regional banks (KRE) Weekly price action more inside the range of the last 2 weeks
Semiconductors (SMH) Follow through on that key reversal lower w/ 250 support
Transportation (IYT) 219 is a level that has been like a yo-yo price
Biotechnology (IBB) Held key support at 125 area-127.50 resistance
Retail (XRT) Granny holding 60-still in the game-especially since that is the January calendar range low.
Twitter: @marketminute
The author may have a position in mentioned securities at the time of publication. Any opinions expressed herein are solely those of the author and do not represent the views or opinions of any other person or entity.


