Gosh, it’s been a minute since we have looked at Utilities.
With rising interest rates, in March 2023, utlities fell near the October 2022 lows.
Currently, XLU is changing phases from Bearish to Recuperation.
In my book, Plant Your Money Tree: A Guide to Growing Your Wealth, I say “When Uncle Utes Shows up Drunk at the Door, It’s Time to Pay Attention.”
So, is it time to pay attention?
In the last year, Utilities, as a flight to safety, have been largely ignored.
Higher interest rates are the main culprit.
Also, in the cyclical nature of trading sectors, Utes simply fell out of favor.
However now, with gold flying (see March 19th article) , rates and the dollar falling, and tech stocks extremely crowded, we thought it a good time to take a fresh look.
The 50-day moving average provides support and a super low risk point. Should that level fail, or price close back under 66.75, the trade is done for now.
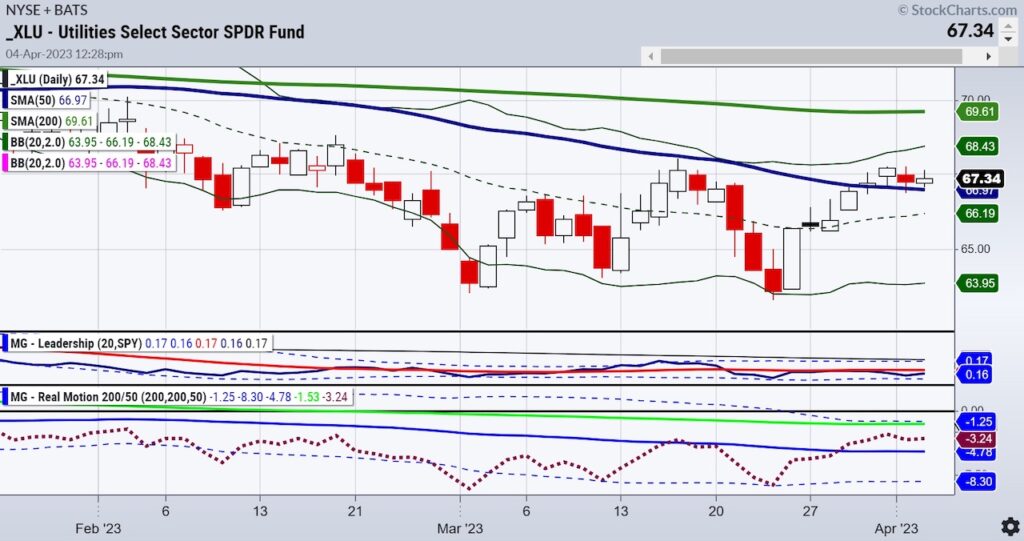
On our Leadership Triple Play indicator, XLU continues to underperform the benchmark.
Should that change, it would be noteworthy.
On our Real Motion momentum indicator, the red-dotted lines show momentum improving and diverging as they are further above the 50-DMA than the price is.
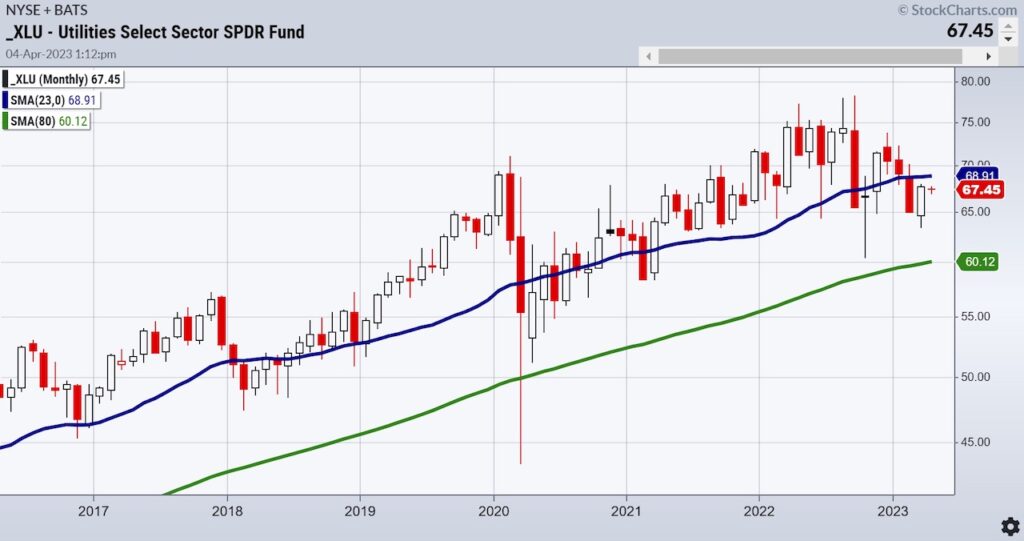
While we have been reporting on the 23-month moving average in the indices and how none have cleared it yet, XLU’s 23-month MA looks a bit different.
XLU only failed the 23-month MA 2 months ago.
That suggests utilities are neither in expansion nor contraction.
Rather, they are trading more on the expectations for rates than on the direction of the indices.
Along with the phase change to Recuperation, we are watching for a a monthly close over 69.00.
A monthly close over that level would suggest a bigger move for Utes, and a more difficult time period for equities.
Stock Market ETFs Trading Analysis & Summary:
S&P 500 (SPY) 405 support and 410 pivotal
Russell 2000 (IWM) 170 support- 180 resistance still
Dow (DIA) Confirmed bullish phase provided it holds 331
Nasdaq (QQQ) 325 the 23-month moving average-huge resistance
Regional banks (KRE) Weak get weaker-41.28 March 24 low
Semiconductors (SMH) 255 key support 270 resistance
Transportation (IYT) 223 pivotal-this sector needs to hold
Biotechnology (IBB) 125-130 new range
Retail (XRT) 60-64 current range to watch
Twitter: @marketminute
The author may have a position in mentioned securities at the time of publication. Any opinions expressed herein are solely those of the author and do not represent the views or opinions of any other person or entity.
: Creating Bullish Divergence?")


 and Semiconductors (SMH): Concerning Price Pattern?")


