Since the first quarter ended with very few instruments above the 23-month, we thought we would start the 2nd quarter by examining where the 4 major stock market indices are.
Over the weekend, the Market Outlook reminded us that “we would likely see a range bound market along with Stagflation. Positive back-to-back quarterly returns since the beginning of the 4th quarter, 2022 bodes well for stocks.
April seasonality trends suggest the buying pressure could continue. Since 1950, the S&P 500 Index has posted average and median April returns of 1.5% and 1.2% respectively. In addition, the index (S&P 500) has finished positive during the month 71% of the time, marking the highest positivity rate on the calendar.”
This is why we really find the 23-month moving average or about a 2-year business cycle to be so important and quite possibly the most important indicator for this next quarter.
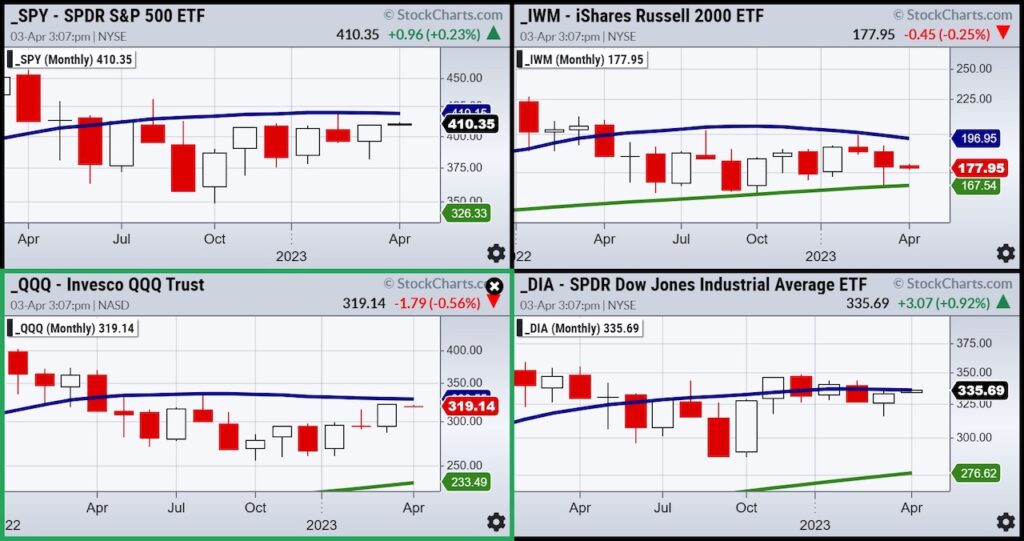
Looking at the four charts of the four major indices, you can see that all their prices are starting April under the 23-month moving average.
Is this significant?
Yes, because after a bullish 2021 and a bearish 2022, 2023 is rangebound and unclear yet whether the market believes the economy will expand.
One thing is certain-2023 remains a bit murky as there is contraction in economic statistics such as the ISM manufacturing number yet higher inflation potential with the OPEC+ decision to cut oil production further.
The FED is in the same pickle this quarter as they were in the last one. Maybe worse.
The index closest to breaking out over the 23-month is the Dow. And that makes sense.
Industrials are strong even in an inflationary environment as they have pricing power.
Next index that could breakout is NASDAQ. And that too makes sense. If the Fed pauses, growth stocks can continue what semiconductor stocks started in March.
The S&P 500 is also close. However, if inflation continues, regardless of what the Fed does or does not do, these companies or the top Fortune 500 can continue to struggle.
The small caps hurt the most. And that too makes sense. Hence, our eyes are here for best clues.
Look to a year ago in April 2022.
The NASDAQ fell below the 23-month MA first, then the small caps and then the rest followed.
Now, we will watch for the opposite. Which index (if any) clears the MA first?
Stock Market ETFs Trading Analysis & Summary:
S&P 500 (SPY) 405 support and 410 pivotal
Russell 2000 (IWM) 170 support- 180 resistance still
Dow (DIA) Confirmed bullish phase
Nasdaq (QQQ) 325 the 23-month moving average-huge
Regional banks (KRE) Weekly price action more inside the range of the last 3 weeks-still looks weak
Semiconductors (SMH) 255 key support 270 resistance
Transportation (IYT) 225 a weekly support level and 223 a daily support level
Biotechnology (IBB) Needs to clear the 130 area
Retail (XRT) Big resistance at 64
Twitter: @marketminute
The author may have a position in mentioned securities at the time of publication. Any opinions expressed herein are solely those of the author and do not represent the views or opinions of any other person or entity.

: Cup (and Maybe Handle) Watch")
 Reaches Important Price Support")

