With the Xth wave of the pandemic ongoing and a good portion of the world’s population still stuck at home, you would not be alone in wondering why the economy and equity markets are doing so well.
Air travel remains materially below previous levels, as does other travel, leisure and eating activities. Unemployment is still materially higher than before the pandemic, to the tune of millions not working. Yet downtown cores remain ghost towns.
BUT… the equity markets are making new highs, S&P 500 Index corporate earnings are now above pre-pandemic levels and so is the economy. Yes, Q1 GDP for the U.S. was above its previous high set in Q4 of 2019.
We all agree things are getting better with vaccines, re-opening, etc. And the equity market is a forward looking pricing mechanism, based on current index levels clearly looking out the other side of the pandemic. With global equities now valued at $114 trillion, $24 trillion (+27%) higher than before COVID become an issue, markets are not just looking past the pandemic but also pricing in a much better / improved environment.
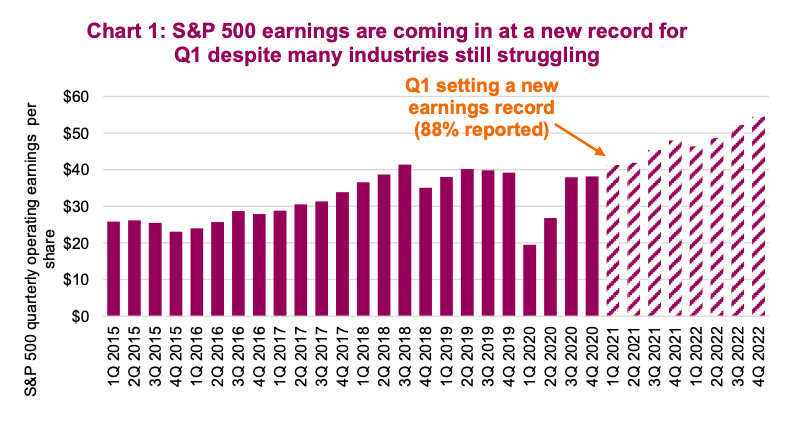
Even more surprising, earnings, which are a snapshot of the currrent environment, have reached new highs for the S&P 500. Earnings in Q4 of 2019 reached $38.18 for the S&P and Q1 of 2021 looks to be coming in just over $41. Which means with many industries still struggling, other industries have generated enough earnings to compensate and exceed pre-pandemic levels in totality. The U.S. economy as well clocked in at at $22 trillion pace in Q1, besting the $21.75 trillion pace of Q4 2019. This with unemployment high and many industries still struggling with activity levels far below pre-pandemic levels.
We believe this disconnect can be explained by the fact that a dollar is not just a dollar, when it comes to the impact on the economy, earnings and the market.
Consumer behaviours have changed materially during this pandemic in most developed economies. We are spending money differently than we did before. Buying more automobiles, RVs, home improvements, technology hardware and sporting goods. Meanwhile spending less on travel, leisure, and of course eating out.
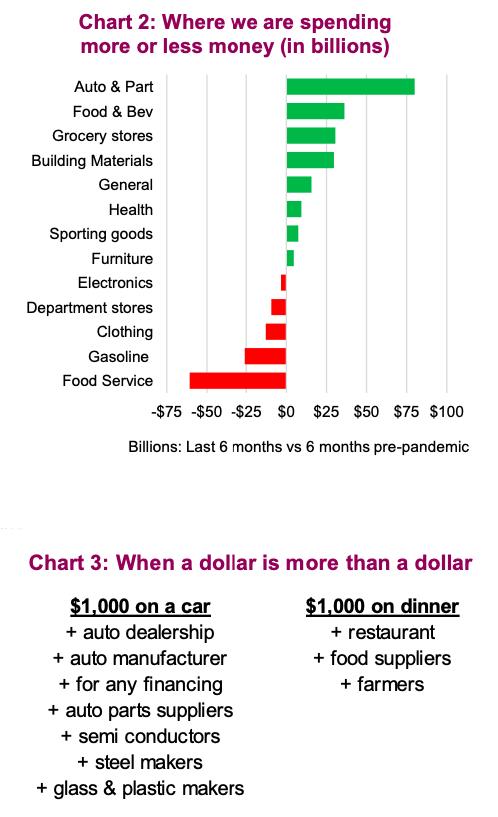
Chart 2 is the change in U.S. consumer spending comparing the last six months to six months before the pandemic (same time of year to avoid seasonaility issues). This change in spending patterns is having an magnified impact on company earnings and the economy because of how each dollar reverberates through the economy. A dollar spent on an automobile has a much bigger impact than a dollar spent on food services (that is eating out). It is not a leap of logic to understand these changing spending patterns are evident in other countries as well.
Chart 3 is a simplified example. $1,000 dollar spent on a car flows through many parts of the economy and many different industries. Compare this to $1,000 spent on a nice dinner (yes you can spend $1k on dinner, probably not worth it but certainly a tasty experience). Money spent on durables, cars, home improvements, furniture, has a bigger economic impact than dinners, gasoline and clothing purchases. Even more impactful, the industries under the car scenario have a greater representation in the equity markets than the industries under the dinner out scenario.
Put this all together and you can see why the economy has reached new highs despite many industries suffering and still elevated unemployment. And it is clear why S&P 500 earnings have really benefited from the changes in spending behaviour as well. We consumers are spending incrementally more on things that have a greater economic and earnings impact.
It will be interesting to see as the re-opening continues and spending begins to revert back towards previous patterns, will this actually be a drag on economic and earnings growth? Looking forward to dining out to see what happens.
Source: Charts are sourced to Bloomberg L.P. and Richardson Wealth unless otherwise noted.
Twitter: @ConnectedWealth
Any opinions expressed herein are solely those of the authors, and do not in any way represent the views or opinions of any other person or entity.


: Important Breakout Retest")


