After the CORE PCE numbers came out on Friday, the market had the expected reaction of selling off in anticipation of a more aggressive Fed.
To us, we find the reaction less than surprising.
What we do find more surprising is that the metals sank along with equities, although gold fell less than 1% while silver fell over 2.5% and the S&P 500 fell just over 1%.
Oil, on the other hand, and the oil sectors- (exploration and service) all rose.
Last week I wrote about natural gas (UNG) and how that had a textbook blow-off bottom at $7.40 a share. Natural gas closed the week up over 20% from that price.
The energy sector, like all commodities, cycle within a cycle.
Speaking of cycles, the indices only rallied into the 23-month moving average or 2-year business cycle resistance (point where they are guilty until proven innocent as far as a soft landing), before last week’s painful retreat.
Natural gas was left for dead as it too broke well below its 2-year business cycle. And to date we do not really know if this rally is like the indices-a bear market rally or the beginning of a more sustained up cycle.
What we do know is that OIH, XLE and the U.S. Oil Fund (USO) all closed green on Friday, and basically unchanged for the week.
Furthermore, all are ABOVE their 23-month moving average or 2-year business cycle.
Will energy continue to go up and what does that mean for the market?
The Oil Service (OIH) chart, although the price sits under the 50-DMA, is still in a stronger phase than the USO chart.
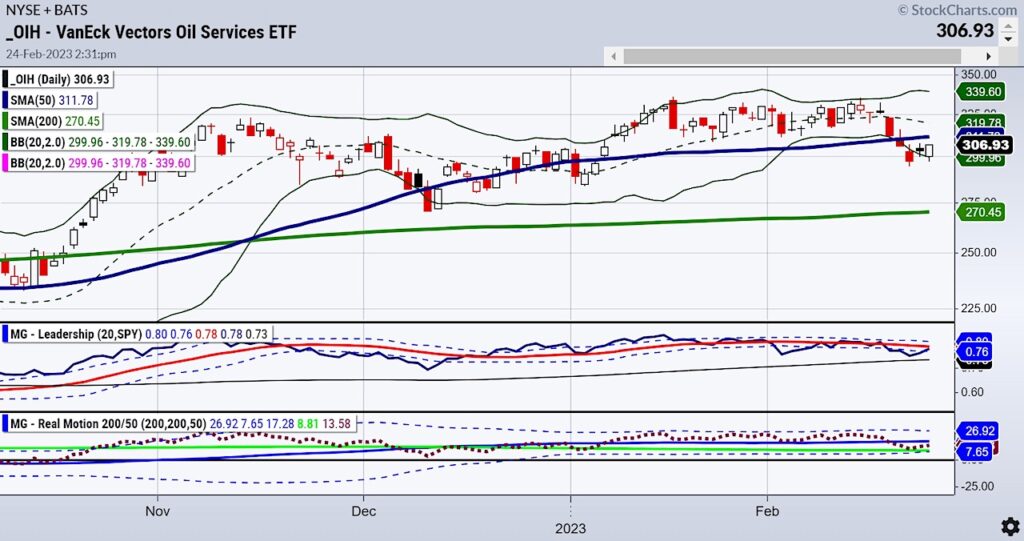
OIH shows the 50-DMA above the 200-DMA. The USO charts shows the 50-DMA under the 200-DMA.
OIH is in a warning phase while USO is in a bearish phase. (Check out our website for more on phases or pick up a copy of Plant Your Money Tree: A Guide to Growing Your Wealth.)
However, OIH underperforms the benchmark according to our Stockcharts Plug in Triple Play indicator.
And USO is now outperforming the benchmark.
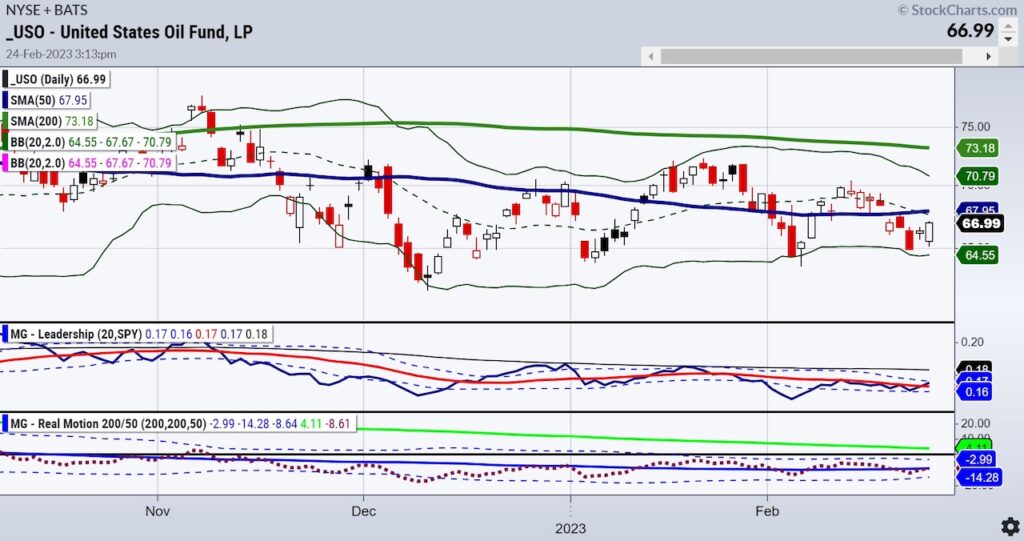
Our Real Motion Indicator, also a Stockcharts plugin, indicates a momentum diversion in USO, as the momentum recaptures its 50-DMA before the price does.
Generally, when we see both a divergence in momentum and in triple play with an outperformance, we wait for a price confirmation.
In USO, a move over 68.00 confirmed, would be a signal to buy.
Most likely, OIH, already in better shape, will move up as well.
The bigger point is that with natural gas potentially bottoming, oil potentially ready to go higher, and the oil services sector already in good shape, this is the place to watch this coming week.
And, most importantly, we see commodities taking turns in leadership.
That tells us the super cycle is getting ready and that commodities offer great active trading opportunities.
Stock Market ETFs Trading Analysis & Summary:
S&P 500 (SPY) 390 support with 405 closest resistance
Russell 2000 (IWM) MA support around 184. 190 has to clear
Dow (DIA) 326 support 335 resistance
Nasdaq (QQQ) 284 big support 300 resistance
Regional banks (KRE) 65.00 resistance 61 support
Semiconductors (SMH) 228 support 240 pivotal 248 key resistance
Transportation (IYT) Most interesting economic sector-Confirms back to a Bullish phase keeping bears on their toes and bulls hopeful
Biotechnology (IBB) 125-130 new range
Retail (XRT) 66-68 huge area to hold if the market still has legs
Twitter: @marketminute
The author may have a position in mentioned securities at the time of publication. Any opinions expressed herein are solely those of the author and do not represent the views or opinions of any other person or entity.

: Worrisome to Broader Market?")

