Focusing on the Economic Modern Family, the weekly charts will help us see who is doing what, why, and perhaps help us understand, for how long.
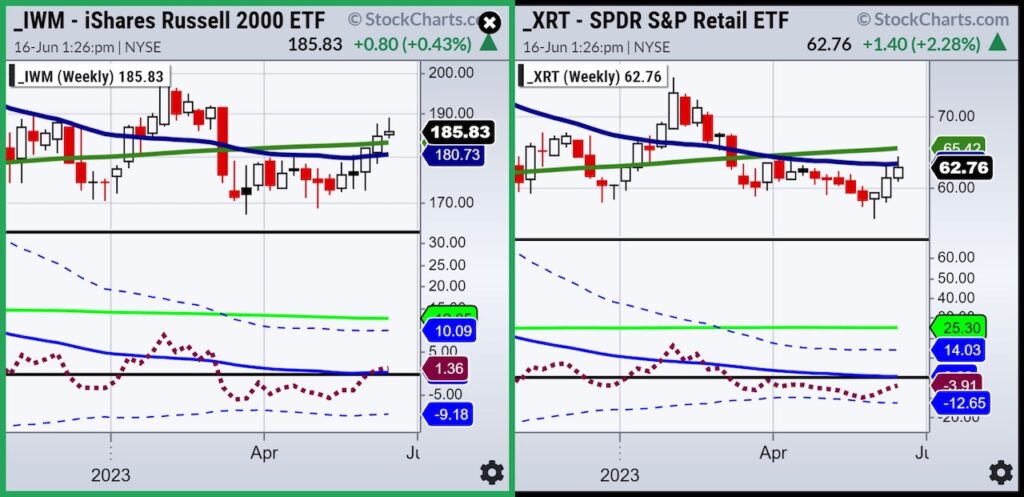
Granddad and Grandma Russell and Retail are the matriarch and patriarch of the Family.
IWM cleared the 50 and 200 weekly moving averages and is in an accumulation phase.
190 remains an elusive point to clear (the 23-month moving average not seen here is key).
Our Real Motion Indicator shows that IWM is stalling in momentum as it is over the 50-WMA (blue) but well under the 200-WMA (green).
It is possible that IWM fails from here at key resistance hence dragging the market down too.
Or it is also possible that IWM is revving up to clear 190, and momentum will begin to increase.
Such is Gramps.
Grandma Retail is below the key weekly MAs. She seriously needs a push above, which of course would help the Russell’s.
Momentum is also inline yet testing the 50-WMA. Granny’s activity this week is key.
Sister Semiconductors (SMH) and Transportation (IYT) are both in good shape.
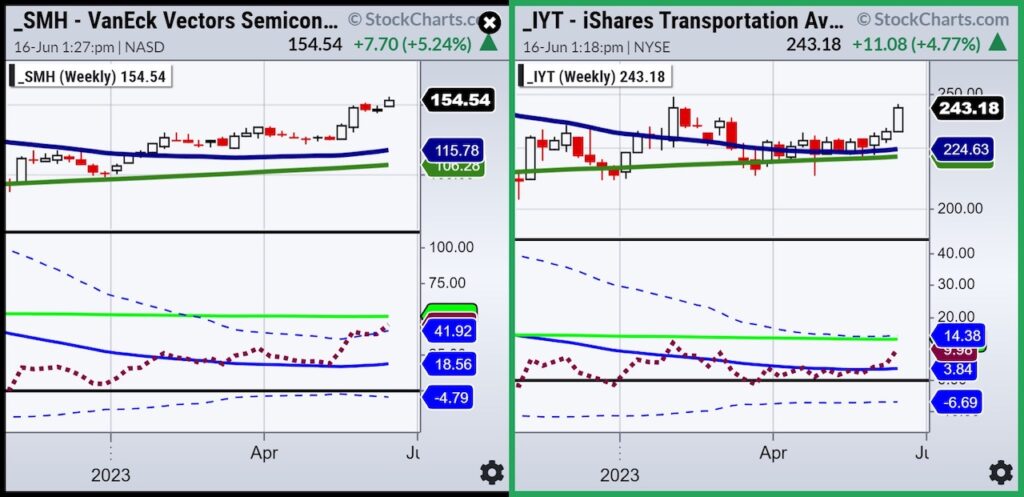
These 2 sectors give us continued optimism that the rally, which began more technical in nature, is now telling us that demand is increasing, and growth stocks did and are doing their job.
If IYT and SMH sustain this rally, we should see IWM and XRT take note.
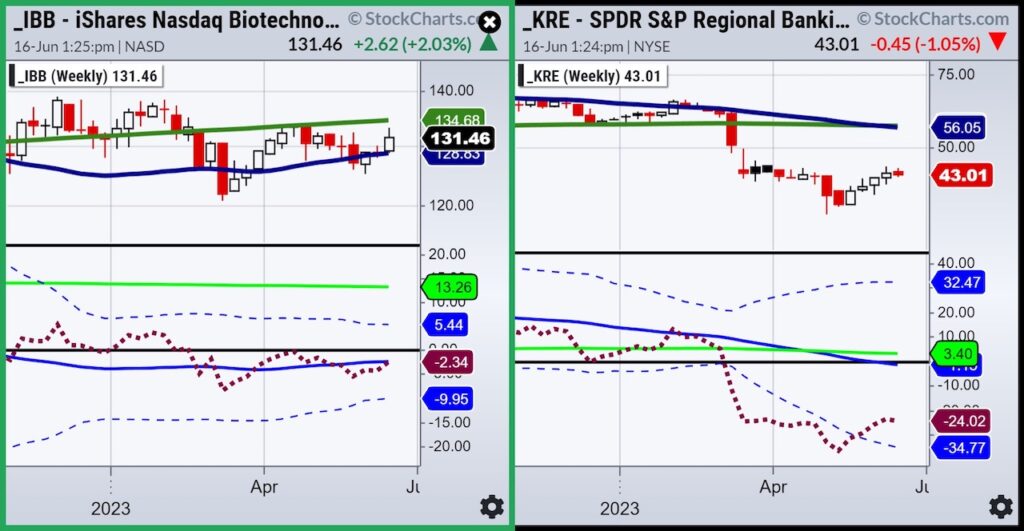
Biotechnology (IBB) could be a very interesting sector to watch, independently of the others.
Should IBB clear over the 200-WMA or 135, then it’s possible to see a move up to 150!
Real Motion and momentum have to catch up though and clear its 50-WMA.
Regional Banks (KRE) or our Prodigal Son is in a world of his own.
After the banking crisis of March that lasted 2 weeks, KRE is trying to bottom. Ending this past week inside the trading range of last week, we will be watching this sector carefully as well.
The Real Motion indicator though, is most interesting as it is working a mean reversion. If momo does not rollover (as it did along with price on Friday) then maybe KRE can surprise.
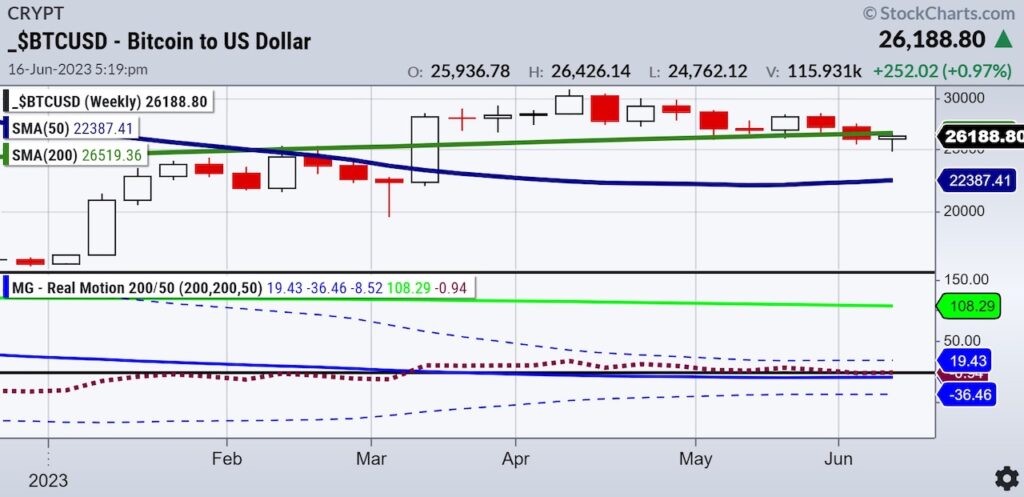
Bitcoin (versus the US Dollar), the Family’s newest member, is in better shape than one would imagine given all the press.
We could say the range between $25-30,000 makes the next moves clear, depending on the way the range breaks.
Momentum is flat, which supports the trading range until further notice.
The Economic Modern Family remains fairly divided.
Is the next leg up or down?
Does IWM or XRT take IYT and SMH’s lead or vice versa?
Is IBB going to run up reflecting real economic growth?
Does KRE signal the all-clear or yet another pending banking crisis?
And Bitcoin-will the decoupling from QQQs reverse or deepen?
We love the Economic Modern Family!
Have an enjoyable long weekend!
Look for Mish on Fox Business Monday, Making Money with Charles Payne.
Stock Market ETFs Trading Analysis:
S&P 500 (SPY) 440 pivotal
Russell 2000 (IWM) 23-month MA 193 still a bit away
Dow (DIA) 34,000 in the Dow now pivotal
Nasdaq (QQQ) 370 target hit proceeded by some selling
Regional banks (KRE) 42 support, 44 pivotal
Semiconductors (SMH) 150 now major support.
Transportation (IYT) 237 area the 23-month moving average
Biotechnology (IBB) 121-135 range
Retail (XRT) Back below the 200-DMA as the week ends. Granny could rule
Twitter: @marketminute
The author may have a position in mentioned securities at the time of publication. Any opinions expressed herein are solely those of the author and do not represent the views or opinions of any other person or entity.


