Forecasting is hard, especially about the future, but with the right indicators we can make it at least a little less hard.
In today’s article I show how important valuations can be in determining long term returns for emerging market equities. It’s a unique angle on what is generally a well-understood principal in asset allocation.
The chart comes from a piece of research I did which looked across global equity markets at the relationship between the PE10 and expected returns.
The chart shows the 10-year forward price change across time against the PE10 valuation metric for Emerging Markets.
Emerging Markets Valuation Chart
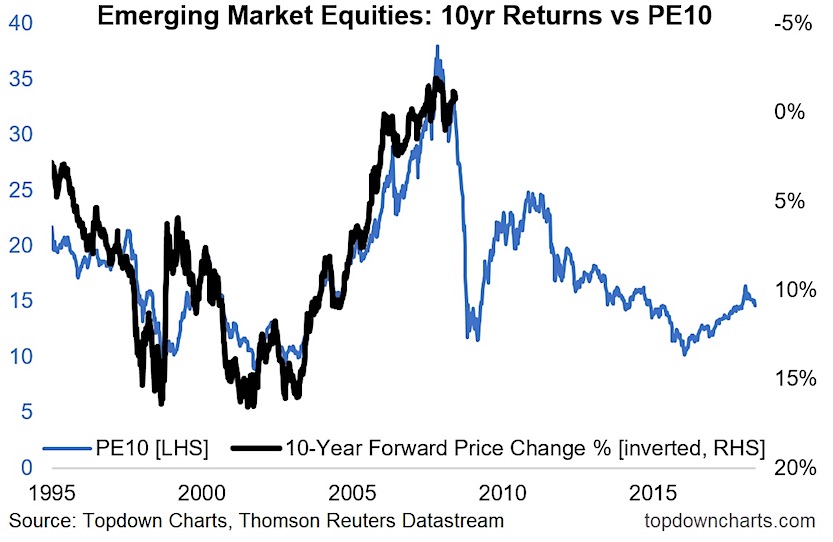
On the detail, the PE10 valuation ratio takes price divided by trailing average earnings over the last 10 years. The 10-year forward price change is the rolling 10-year CAGR, but shifted back on the chart to line up with the timeframe (thus why the black line only goes to 2008 – i.e. those investing then will only be seeing a 10-year return this year). Notably, the 10-year forward return is shown inverted.
The link between the two series is fairly close. There’s a simple economic logic behind this relationship: the higher the valuation you pay at the time of purchase, the harder it is to earn decent returns in the future. The reason is basically that you would need valuations to keep rising to do much of the heavy lifting for returns.
In that respect, when valuations are low – particularly at an extreme, it is much easier/plausible for valuations to rise and do the heavy lifting on raising future returns. In other words, valuation (or price paid) matters.
It’s worth noting that the pace of earnings growth is also critical (especially for emerging markets), but a lot of the time swings in valuations have a bigger impact. The other thing is that this chart only shows price or capital returns, and over the long run dividends tend to be a meaningful and relatively stable driver of total returns.
But for now, keep an eye on valuations, because they can tell you your future.
Twitter: @Callum_Thomas
Any opinions expressed herein are solely those of the author, and do not in any way represent the views or opinions of any other person or entity.

: Cup (and Maybe Handle) Watch")
 Reaches Important Price Support")

