- The Ten-year U.S. Treasury note yields 1.61%.
- 10-year high-quality corporate bonds yield 2.09%.
- The rate on a 30-year mortgage is 3.05%.
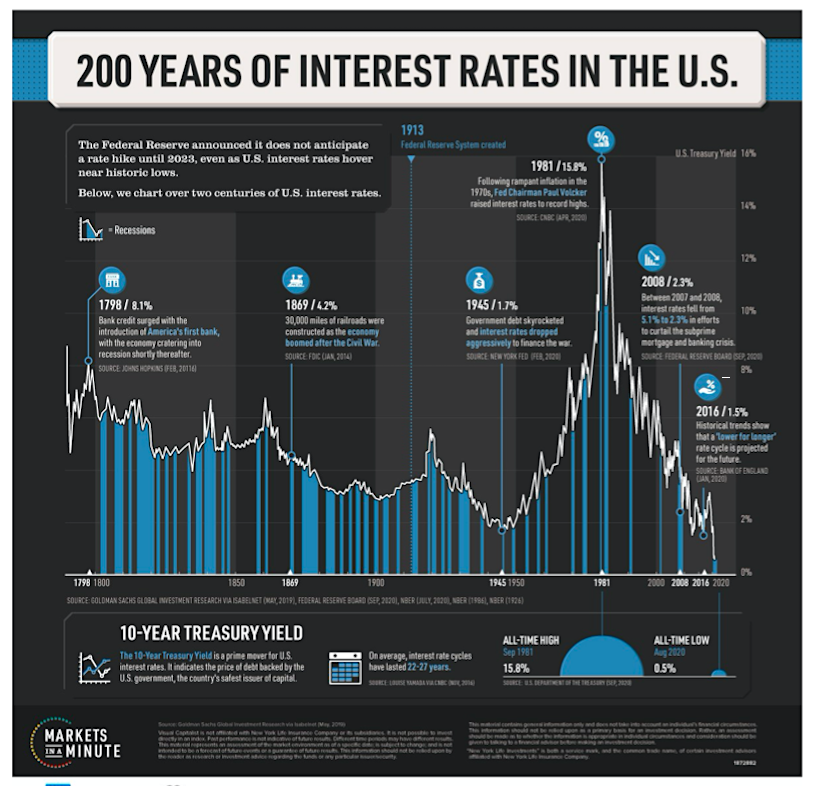
Despite recent increases, interest rates are hovering near historic lows. We do not use the word “historic” lightly. By “historic,” we refer to the lowest levels since the nation’s birth in 1776.
The graph below, courtesy of the Visual Capitalist, highlights our point.
Despite 300-year lows in interest rates, investors are becoming anxious because they are rising. Recent history shows they should worry. A review of the past 40 years reveals sudden spikes in interest rates and financial problems go hand in hand.
The question for all investors is how big a spike before the proverbial hits the fan again?
Debt-Driven Economy
Over the past 40 years, debt has increasingly driven economic growth.
That statement on its own tells us nothing about the health of the economy. To better quantify the benefits or consequences of debt, we need to understand how it was used.
When debt is used productively, the interest and principal are covered with higher profits and sustained economic activity. Even better, income beyond the cost of the debt makes the nation more prosperous.
Conversely, unproductive debt may provide a one-time spark of economic activity, but it yields little to no residual income to service it going forward. Ultimately it creates an economic headwind as servicing the debt in the future replaces productive investment and or consumption.
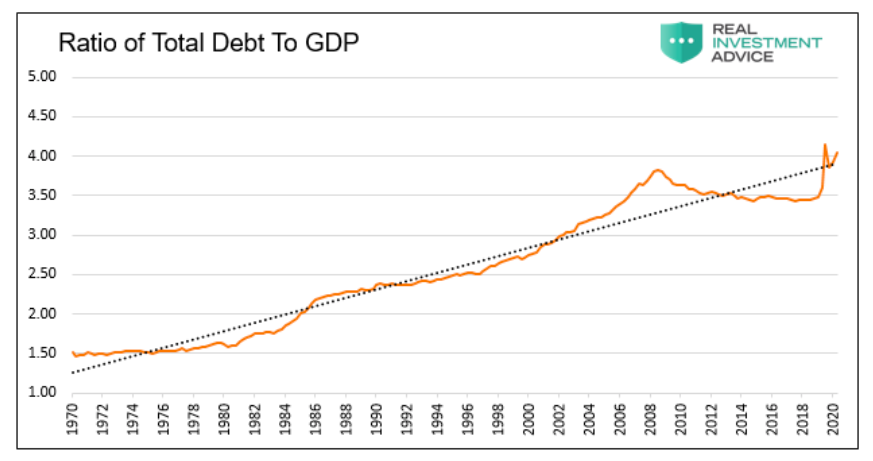
The graph below shows the steadily rising ratio of total outstanding debt to GDP. If debt, in aggregate, were productive, the ratio would be declining regardless of the amount of debt.
U.S. Economic Fragility
As shown above, the U.S. economy is overly dependent on unproductive debt. Not surprisingly, secular growth rates have been trending lower for three decades. The massive amount of unproductive debt added in the last year will only further reduce future growth rates.
The Fed is keenly aware of this weakness but refuses to acknowledge the problem or incentivize productive debt. Instead, they tout the temporary economic benefits of more debt with exceedingly low interest rates. In doing so, they egg on speculation and consumption, not productive debt.
In Wicksell’s Elegant Model we stated: “On the other hand, if market rates of interest are held abnormally below the natural rate, then capital allocation decisions are not made on the basis of marginal efficiency but according to the average return on invested capital. This explains why, in those periods, more speculative assets such as stocks and real estate boom.”
“But when short-term market rates are below the natural rate, intelligent investors respond appropriately. They borrow heavily at the low rate and buy existing assets with somewhat predictable returns and shorter time horizons. Financial assets skyrocket in value while long-term, cash-flow driven investments with riskier prospects languish.”
Simply, the Fed’s policy is to keep the party going without worrying about tomorrow’s hangover. As they have shown, the hair of the dog – more debt, helps keep the party going tomorrow. Unfortunately, the cost of such reckless policy is the nation’s financial fragility.
Evidence of this condition is quite apparent. Currently, investors are fretting about higher interest rates despite the fact they have only risen to the lowest levels of the past 300 years.
Measuring Fragility
Looking back over the last 40 years reveals a troubling problem. Every time interest rates reach the upper end of its downward trend, a financial crisis of sorts occurred. The graph below charts the steady decline in rates and GDP along with the various crisis occurring when rates temporarily rose.
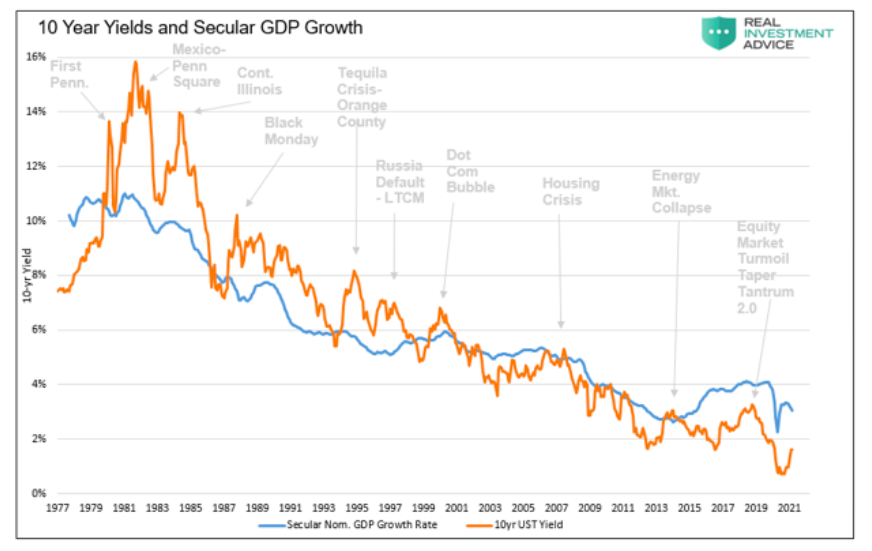
Given crises frequently occur when rates rise sharply, we should contemplate how high rates can rise before the next crisis. Notice, as time goes on it takes less and less of a rate increase to generate a problem. The reason, as highlighted earlier, is the growth of debt outpaces the ability to pay for it.
To quantify how much more rates can rise, we present the graph below. The red shaded area in the chart is a proxy calculation for the change in the interest expense on all debt. We calculate the change using debt outstanding, one-year change in interest rates, and GDP. We normalize the data to the size of the economy.
The current one-year change in the proxy interest expense is up 3.50% from a year ago. As shown, the last two significant crises (2000 and 2008), along with a few minor ones, all happened when the proxy rose between three and four percent.
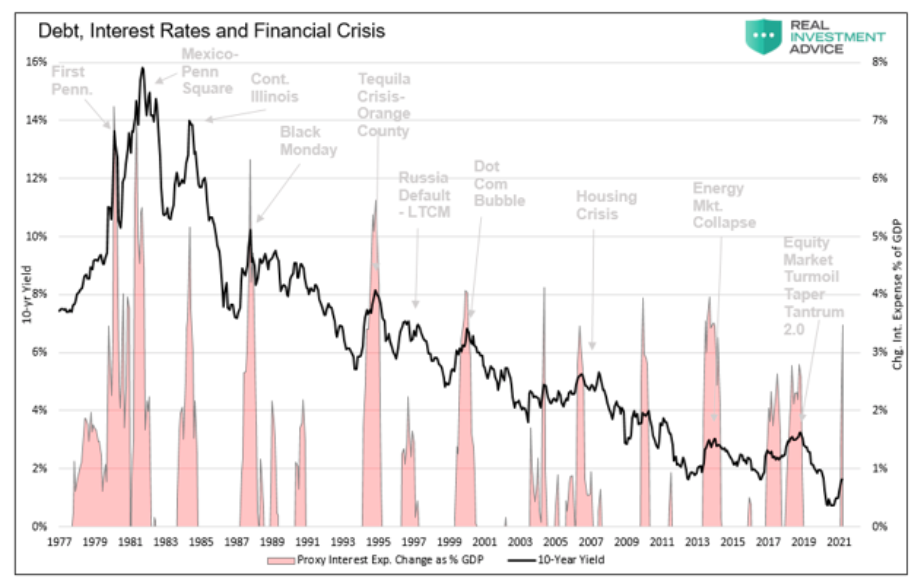
If Ten-year UST yields increase to 2.0% (currently 1.60%) by May, the proxy will increase to 5.25%, well above the 4.0% that popped the dot com and housing bubbles.
Summary
The proxy interest expense model is far from perfect, but it provides evidence the threshold of pain to withstand higher rates is small.
If the Ten-year UST rate increases to 1.75% by April, the proxy interest expense will exceed all peak levels since 1990. However, this time, massive fiscal stimulus, monetary operations, and economic reopening may mask the rise in rates for a little while, allowing them to rise further.
Like every other time rates rose “too much,” a crisis will occur if rates keep increasing. It seems the only question is when the Fed will come running to the rescue as they always do.
Buckle up, the math says a crisis may be closer than anyone imagines.
Twitter: @michaellebowitz
Any opinions expressed herein are solely those of the author, and do not in any way represent the views or opinions of any other person or entity.


