TOPPING PROCESS DOT-COM BEAR MARKET
One of the best ways to strip opinions and personal bias out of any stock market analysis is to compare facts from the past to present-day facts. Today we’ll look at stock market breadth in 2019 and compare it to different periods in the past.
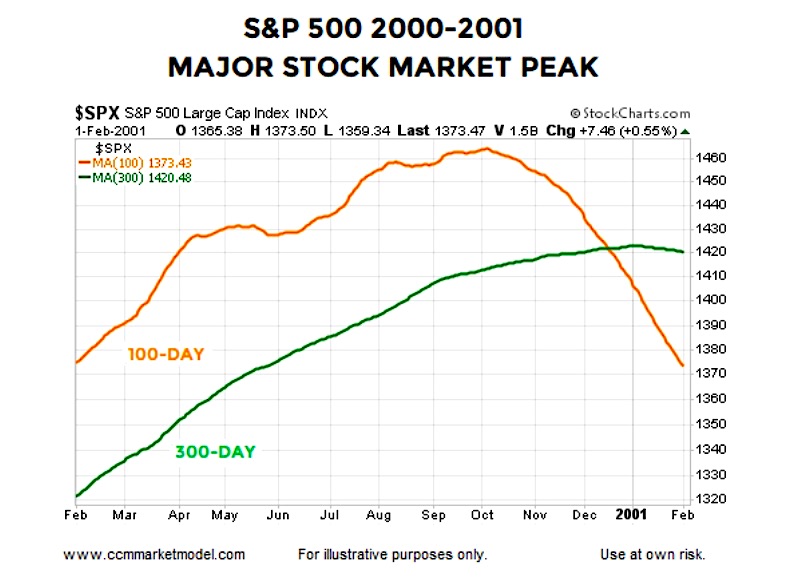
Near the latter stages of a major stock market topping pattern that formed between 1999 and 2001, the S&P 500’s 100-day moving average dropped below the 300-day moving average. The slopes of both moving averages rolled over in a concerning manner. S&P 500 Index – INDEXSP: .INX
TOPPING PROCESS FINANCIAL CRISIS BEAR MARKET
All of the same boxes could be checked during the latter stages of the topping process in 2007-2008. The turn in the moving averages and the 100 day moving average’s drop below the 300 day moving average was indicative of shifts in the intermediate and long-term trends, which speaks to a shift in expectations about future economic outcomes.
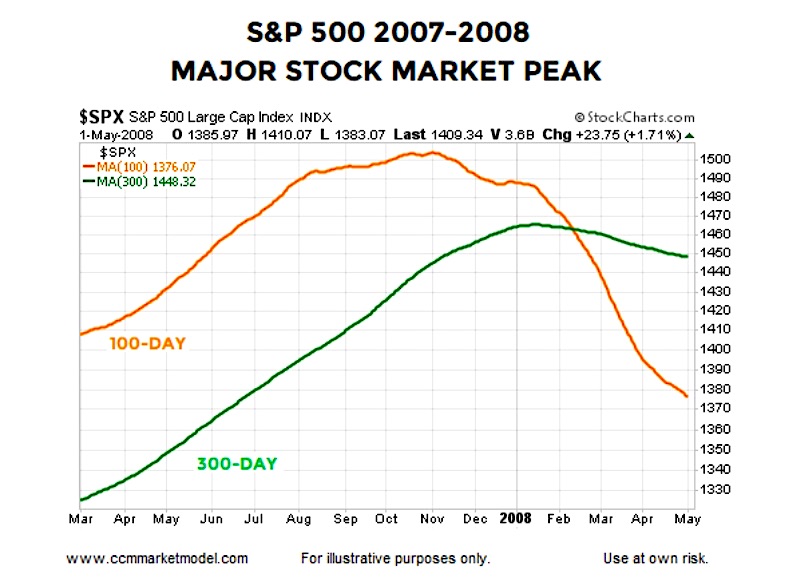
By the time the 100-day moving average recaptured the 300 day moving average in the 2000 case, the peak to trough decline in the S&P 500 reached 49.15%; the damage in the 2007 case was 56.78%. Therefore, it might be helpful to ask:
Does June 2019 look anything like the major stock market peaks in 2000 and 2007?
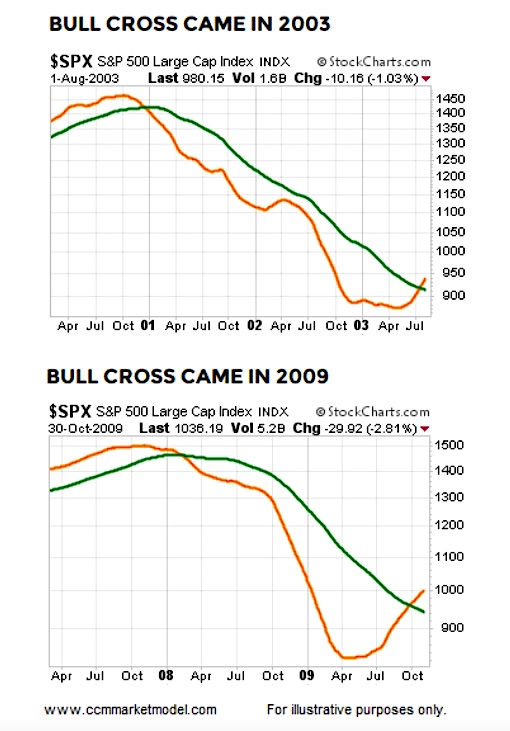
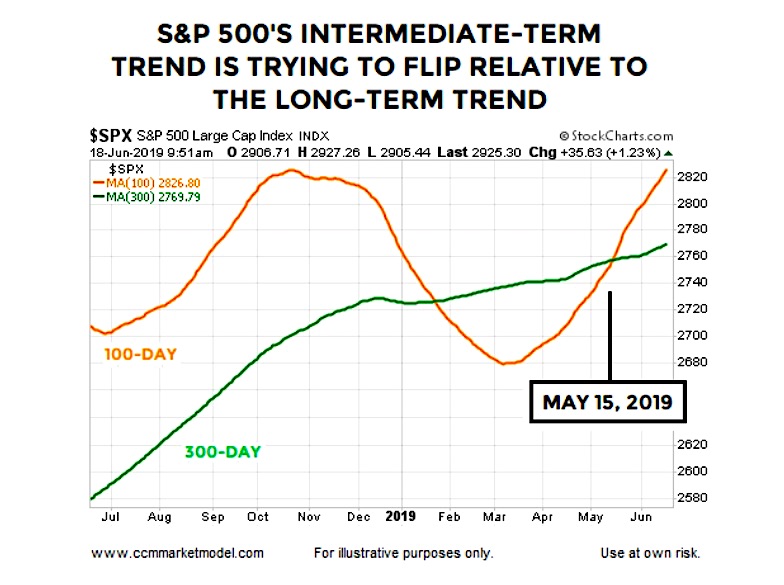
Given really good things happened after the bullish crosses in 2003 and 2009 shown above, and given the look of the 2019 chart below, it is difficult to make the argument the S&P 500 is currently in the process of forming a major peak similar to the stock market peaks in 2000 and 2007.
In short, the 2019 chart looks more like the major bottoms in 2002 and 2009 than the major peaks in 2000 and 2007.
WHAT CAN WE LEARN FROM THE 100’S CROSS OF THE 300?
Since 1949, how many times has the 100-day moving average crossed above the 300-day moving average?
The answer is 20 times, including a bullish cross on July 15, 2003 and a bullish cross on September 25, 2009; both occurred after the major bear market declines. What happened next in the stock market? One to five years after the bullish cross, the S&P 500 Index was higher in roughly 95% to 100% of the cases with average gains ranging from 15.45% to 66.38%.
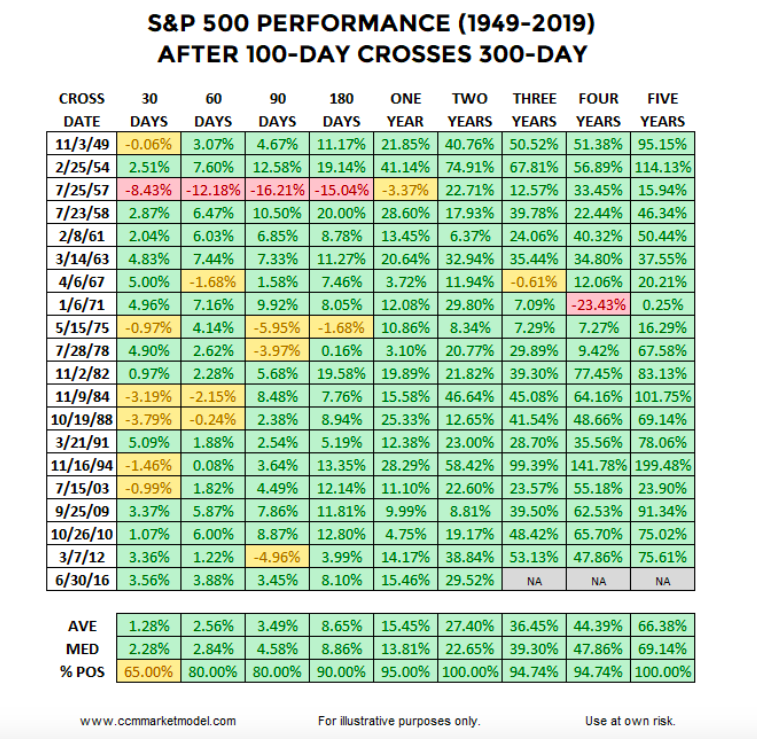
In 2019, the 100-day moving average just cleared the 300-day moving average, which represents a set of measurable facts. The table above shows what happened next in every historical case dating back to 1949. The table represents another set of facts.
A common response might be, “That’s all great, but we have slowing profit growth, a slowing economy, and a serious trade war in 2019”.
That’s all true, but…
continue reading this research article on the next page…

: Cup (and Maybe Handle) Watch")
 Trading Near Top Of Price Range")

