
Ok, so this rat looks more heavy metal than metal.
You know how hard it is to find rats to photograph?
At the beginning of the year, as I do every Chinese New Year, I research the predictions of Raymond Lo.
This year he said, “The cycle of the Fire Element ended in 2017 with Yin Fire Rooster. When the Dog year arrived in 2018, the Fire entered the grave, resulting in setbacks in the economic atmosphere. Year of the Pig represented the termination of the Fire Element and begun the pessimistic energy of Water.”
“Therefore,” Lo went on to say, “The general economic atmosphere is entering a bearish cycle and the pace of growth will slow significantly.
Looking back to 2008 (also a Rat Year), Wall Street was in turmoil after the financial tsunami of the mortgage industry that lead to the recession.
Lo also says that pessimism, cynicism and despair will set in and contribute to an economic decline.”
What Lo or anyone could not have imagined, was the rapid decline in both stock prices and economic growth from a virus.
However, we knew the market was in a “Phantasmic Irrationality” as per my blog on February 2nd, where we pointed out that “While the S&P 500 and NASDAQ 100 have enjoyed multiple new all-time highs over and over with the last one made just a week ago, the Russell 2000 struggled and failed to get to its all-time high from 2018.
In fact, the case for a giant double top in the Russell’s now grows stronger.”
Between our Metal Rat in water and our early indication from the Russell 2000, how do we know if a 5-year bear market has already begun?
As one who wrote a book on phases, in early February, the Russell 2000 went into a caution phase.
Caution means exactly that; one should heed caution.
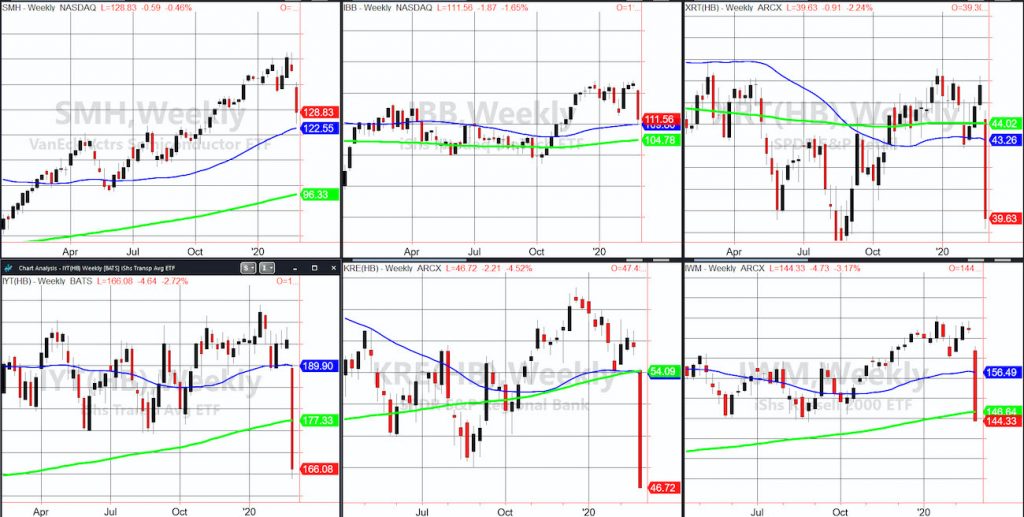
Looking at the weekly charts, top left, Semiconductors, the leading sector for the last several years, remains in a bullish phase if it holds the 50-week moving average (blue line).
Top middle is Biotechnology IBB. That too is in a bullish phase on the weekly charts.
Top right is Granny Retail XRT. That very nasty red bar depicts the trouble with the retail sector and the waning consumer confidence. That weekly phase is distribution.
Bottom left is Transportation IYT. That too is in a distribution phase.
Regional Banks, bottom middle, is in a bearish phase. Why? Because the 50-WMA crossed below the 200-WMA or what is known as a death cross.
Bottom left is the Russell 2000, like Granny, in a distribution phase.
Four of the six Family members have seen massive liquidation and illustrate why the “inside” of the market is the mirror of the economy.
Note that on the daily charts, the phases are all caution or distribution because the 50-DMA has yet to break below the 200-DMA.
This is due to the rapid decline. The moving averages are lagging and not leading indicators.
In other words, by the time the 50-DMAs drop far enough to break the 200-DMAs, the price could be way lower.
Best scenario would be some period of price consolidation to give the moving averages time to adjust.
All the indices except for NASDAQ 100 broke their 200-DMAs. QQQs held its 200-DMA on Friday, so it remains the sole index in a caution and not distribution phase.
Over time, everything could go into an official bearish phase.
For now though, watch the NASDAQ and Semiconductors to hold their 200-DMAs or not.
On another note, to follow up with the ETF TAN I wrote about this week, it held its 50-DMA nearly to the tick and is one of the few sectors in a bullish phase on the Daily.
That too will be a “tell” if it holds or rallies more from here.
Always look to the strongest phases to buy, especially when they retrace and hold the major moving averages. And always look to the weaker phases to short, especially when they retrace to and fail their key moving averages.
However, please be aware that short covering rallies can be deceptive and perceived as a bottom. If Lo is right, there is a good chance this next rally (should we get one) is a new short opportunity, especially if the phases do not improve.
S&P 500 (SPY) 302.10 is the area to close above with resistance all the way up. Key support now is 287.
Russell 2000 (IWM) 146.67 the 200-week moving average is the perfect pivotal point.
Dow Jones Industrials (DIA) Possible capitulation low if closes over 255.12
Nasdaq (QQQ) Held the 200 DMA perfectly and now must close over 207.17
KRE (Regional Banks) Doji day with 46 support and 48 point to close above.
SMH (Semiconductors) 124.26 the 200-DMA-held to the tick. Over 132.68 on a close is the healthiest sign.
IYT (Transportation) 162 held with a move over 169.67 best.
IBB (Biotechnology) Held 110 which has to continue to hold. 120 good resistance.
XRT (Retail) 38.00-38.50 is critical support to hold for the health of retail with 43 now resistance.
Twitter: @marketminute
The author may have a position in the mentioned securities at the time of publication. Any opinions expressed herein are solely those of the author, and do not in any way represent the views or opinions of any other person or entity.

: Showing Some Signs of Emerging Strength")

