On the 30-year anniversary of Black Monday, we take a look at the magnitude of the stock market crash in terms of today’s market.
By now, you’ve probably gotten wind of the fact that today is the 30-year anniversary of the stock market Crash of 1987, aka Black Monday.
For those living in the markets at the time, it will be an event and a day they’ll never forget. That is certainly the impression I get from various first hand accounts of the Crash, including that of my father and J. Lyons Fund Management, Inc. President, John S. Lyons. His recent post, Personal Recollections of the Crash of 1987, is really an eye-opener in terms of what it was like to go through the experience, as well as potential lessons to draw from it (or not).
In commemoration of the anniversary, we thought it would be fun to “recreate” the chart of the ‘87 Crash, using today’s Dow Jones Industrial Average (INDEXDJX:.DJI). It might give folks, especially those who weren’t involved in the markets at the time, a better perspective of the magnitude of the Crash.
To be clear: WE ARE NOT FORECASTING A CRASH. This is simply an amusing exercise to help folks gain an appreciation of the size of the decline on Black Monday, 1987.
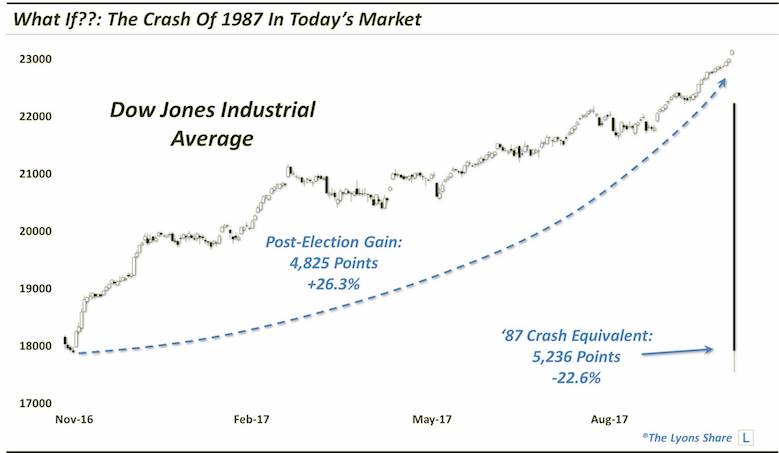
First off, by the numbers, the ‘87 Crash resulted in a loss of 22.6% in the Dow Jones Industrial Average (DJIA). Based on yesterday’s close of 23,158 in the DJIA, a 22.6% loss would equate to 5,236 points and drop the index all the way down to 17,922. Here’s what it would look like on a chart:
For those looking for “support” at the time of the Crash, there wasn’t any. As the chart indicates, such a drop in today’s DJIA would similarly see the index slice right through the 200-Day, 500-Day and 1000-Day simple moving averages – in a single day. It would also signify a breakdown below the 23.6% Fibonacci Retracement from the 2009 lows and the 50% Retracement from the 2015-2016 lows.
Perhaps the most visually stirring perspective is the fact that, in one day, the hypothetical crash would wipe out the entire post-election rally since last November. In fact, the DJIA’s closing price at the early November low, 2 days prior to the election, was 17,888, almost the exact 22.6% crash destination mentioned above.
Put another way, in the 240 days from the pre-election low to yesterday’s all-time high, the DJIA gained 5,270 points. A 22.6% crash would equate to a loss of 5,236 points – in one day!
That lends an amazing perspective into the sheer magnitude of the ‘87 Crash (it’s also, in our view, a nod to the impressiveness of the post-election rally).
Twitter: @JLyonsFundMgmt
The author may have a position in mentioned securities at the time of publication. Any opinions expressed herein are solely those of the author, and do not in any way represent the views or opinions of any other person or entity.


