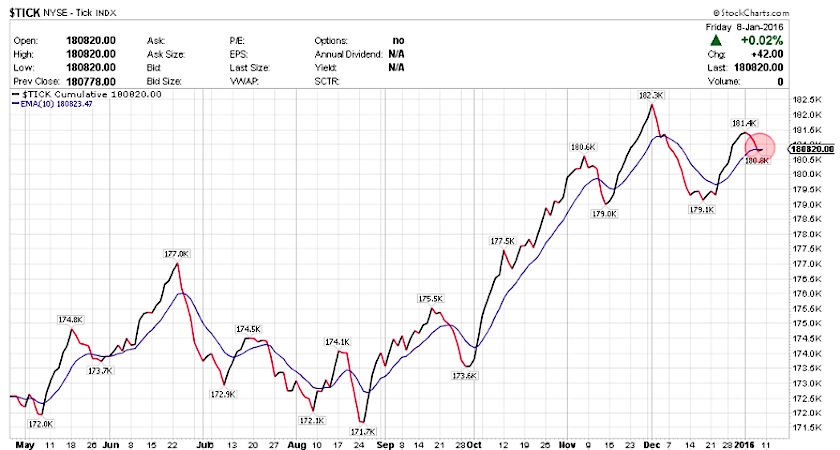
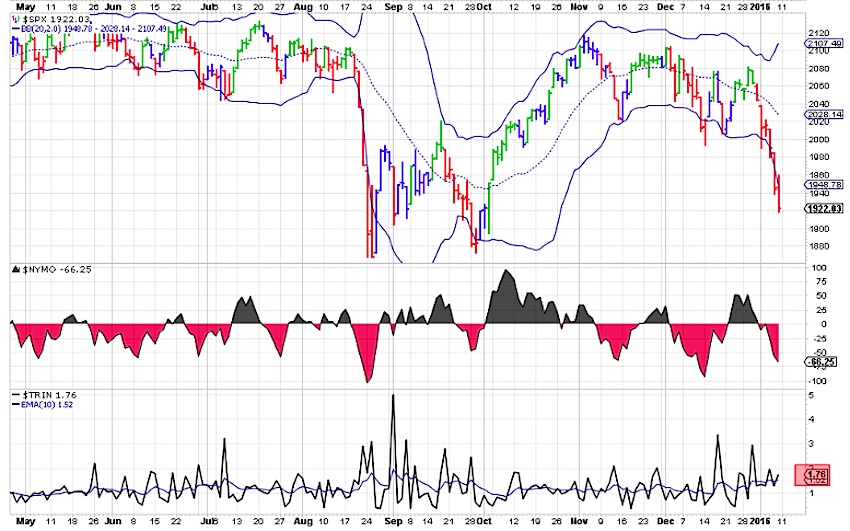
$TRIN & $TICK
What do you expect when you see so many -1000 $TICK? The TICK line has crossed lower below it’s 10 EMA but not falling yet. $TRIN was higher during the week pushing over 2.00 early in the week before simmering down a bit on Thursday and finishing the week still elevated at 1.76. Keep an eye on these 2 along with $NYMO for clues.
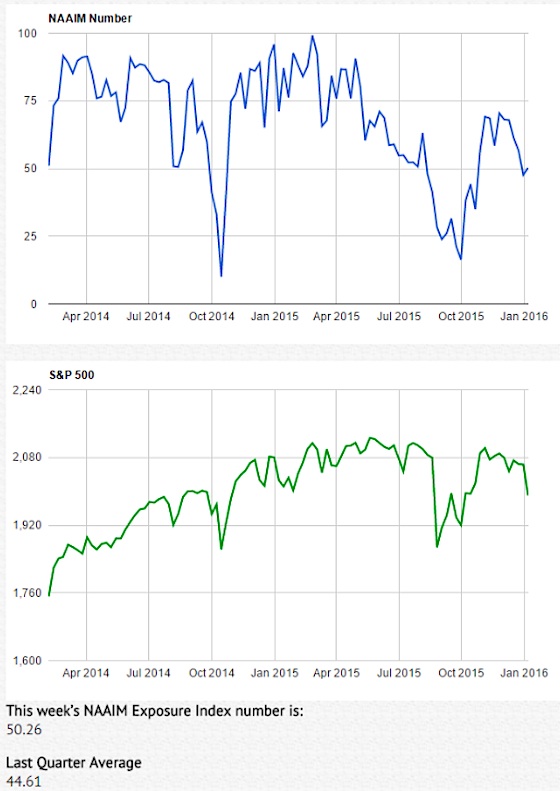
NAAIM Exposure Index
The NAAIM Exposure Index represents the average exposure to US Equity markets reported by members. The green line shows the close of the S&P 500 Total Return Index on the survey date. The blue line depicts a two-week moving average of the NAAIM managers’ responses. Last week’s Index number is at 50.26. This is a sentiment indicator but would like to see sub 35, 30 or even 20 levels that we’ve see in the prior declines. This is another one that is indicating some complacency about the stock market and current price action.
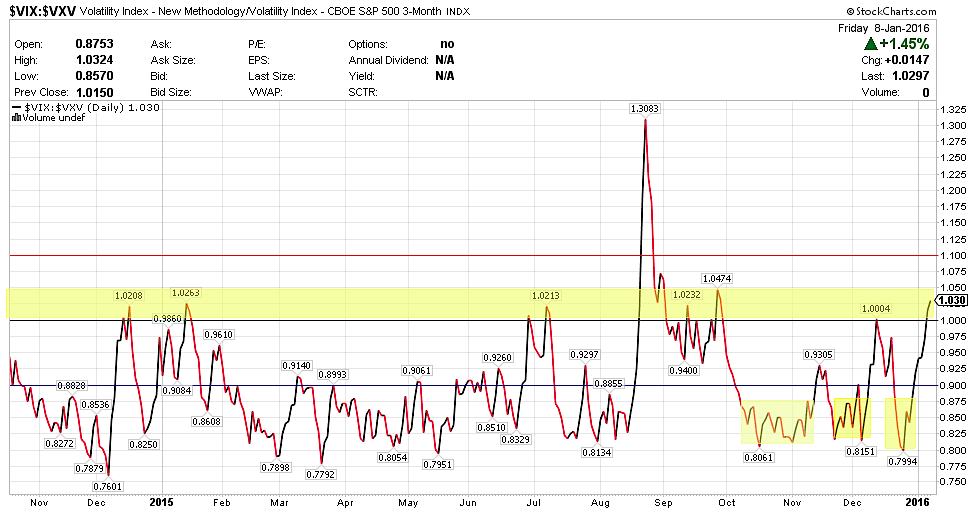
$VIX:$VXV Ratio – Volatility Term Structure
VXV is the 3 month volatility index. The ratio relationship between $VXV and $VIX (30 day volatility) often spells trouble for stocks if > 1.00.
Well this is over 1.00 at 1.030 but at a place where it normally reverses. If it rises higher it might spell trouble for the market as a whole… and be an indicator of real fear entering the market.
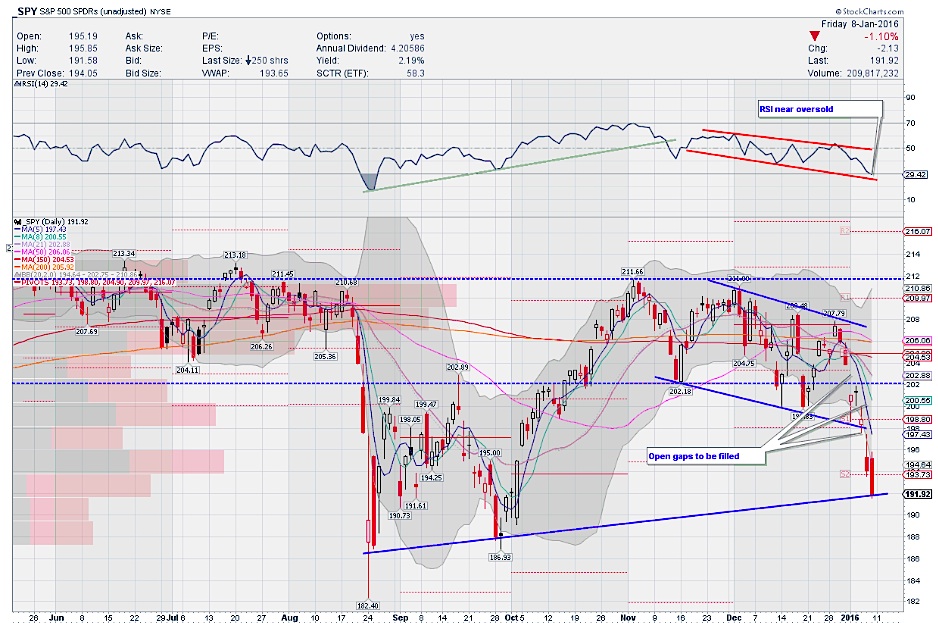
S&P 500 ETF (SPY) Daily Timeframe
With the swift decline in stocks, the S&P 500 moved well outside its Bollinger band.
With respect to Momentum indicators, RSI is falling and now right around the oversold zone. MACD crossed lower and is falling. Slow STO however, is oversold and embedded and right at a point where it can turn to give a bounce.
The first bounce normally goes towards either the falling 5, 8 or 21 day SMA into the Bollinger Bands and can be very fast and furious. At the very least, I will be looking to see if the gap near 195 gets closed. There are 2 Spikers or block trades that came into play and those price points have not been taken out yet. They are near 199 and 204 respectively. Either way, I’m expecting stocks to bounce before $VIX expiry but price can continue lower before that bounce as well.
You can read more of my weekly analysis on my website. Thanks for reading and have a great week.
Twitter: @sssvenky
The author has a position in S&P 500 related securities. Any opinions expressed herein are solely those of the author, and do not in any way represent the views or opinions of any other person or entity.
: Creating Bullish Divergence?")


 and Semiconductors (SMH): Concerning Price Pattern?")


