It was the worst 5 day start to a New Year in the history of the stock market. No where to hide for many who came in long into the New Year. Just brutal selling, nothing more.
Candlesticks across all timeframes speak for themselves. If 2015 was considered a challenging year, welcome to to 2016 – focus and discipline will be key. It seems to me that the rate hike from Fed has not been received well plus the there is a growing fear about a recession.
Here are some stock market statistics through the first full week of the year:
$SPY S&P 500 ETF: -5.86%
$QQQ Nasdaq 100 ETF: -7.02%
$IWM Russell 2000 ETF: -7.79%
$IBB Biotech Sector ETF: -10.68%
$USO United States Oil ETF: -10.91%
$XLF Financial Sector ETF: -7.26%
And then there was China with the Chinese stock market down over 12% and a lot of chaos. Global slowdown, recession talks and company earnings growth slowing and more. And what about market breadth? Yikes. What an eventful week!
Having said that, let’s take a look at the upcoming week.
Economic Calendar
From an Economic Calendar standpoint, we have Beige Book at 2:00 PM EST on Wednesday. And on Friday, we have PPI-FD, Retail Sales, Empire State Mfg Survey, Industrial Production and Consumer Sentiment. Apart from these, we have Fed representatives talking throughout the week.
Market Breadth Indicators
As you may have seen me post last week, we’re oversold on many fronts with respect to Breadth Indicators. However, oversold can remain oversold for an extended period of time. Having said that, the biggest and fastest moves upwards do occur during corrective phases or even bear markets.
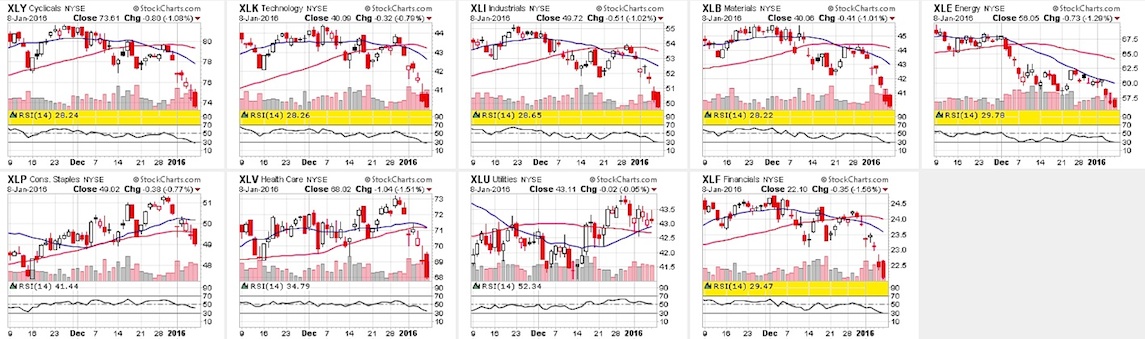
Sector Performance – Candlestick Glance
Here’s a view of the stock market sectors (S&P 500) and their current Relative Strength Index (RSI) readings. 6 out of 9 sectors are oversold. 2 of them nearing oversold. Oversold can remain oversold but a bounce is quite possible.
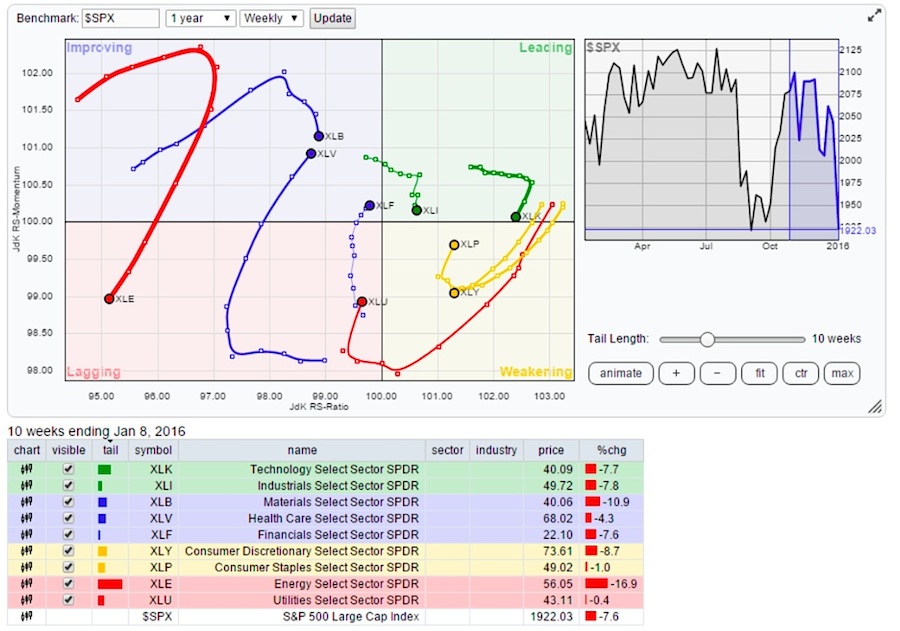
The Relative Rotation Graph (RRG) chart shows the leaders and the laggards across the 9 stock market sectors. Market breadth and relative strength is weak. No leadership yet.
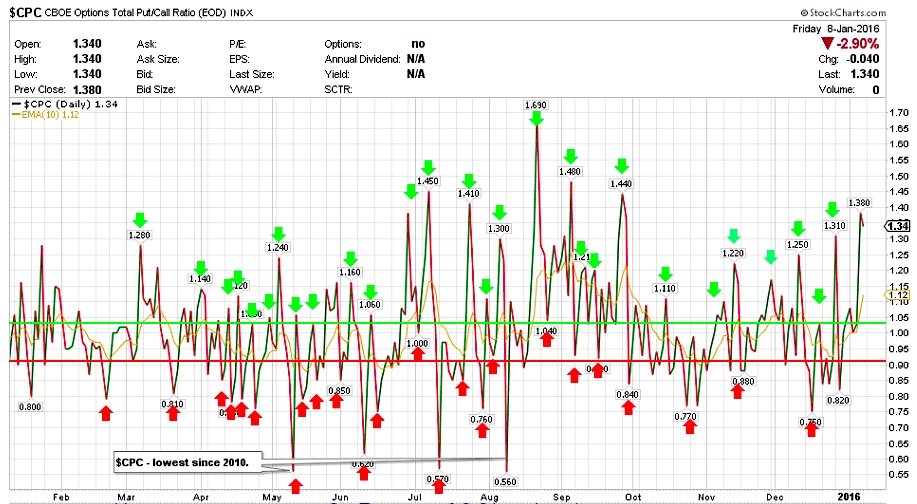
$CPC – The Put-Call Ratio
The CBOE Options Total Put/Call Ratio finished the week at 1.34. This was close to 1.54 earlier on Wednesday but subsided. Definitely at a spot where it can turn lower.
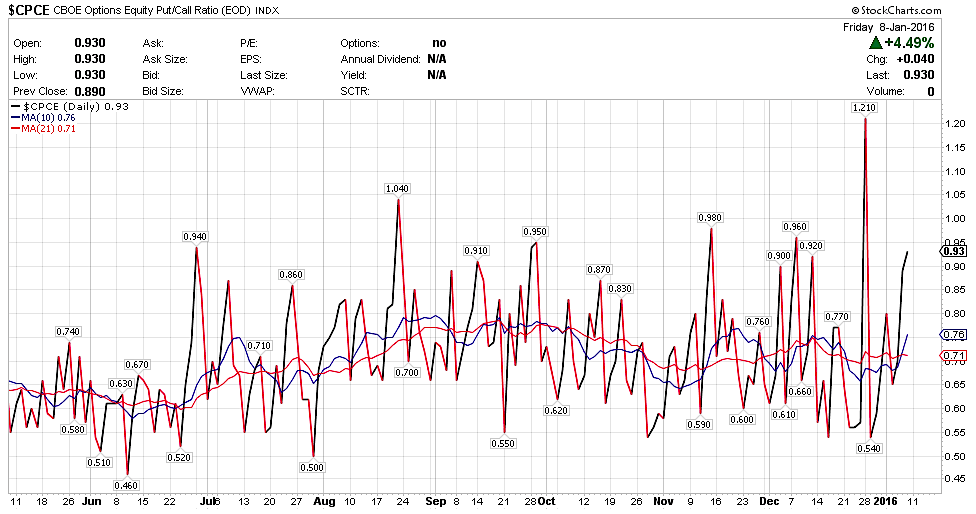
However, when we look at $CPCE, considering that it was the worst ever start to the New Year in the history of the stock market, it is only at 0.93. On Monday and Tuesday, this was at 0.65 and 0.71. This is a caution sign in my opinion that there is still some level of complacency.
Yes there is fear in the market, but if you take a look at prior stock market declines, $CPCE has spiked well over 1.00 or even higher. Something to take note of. Having said that, the 21 day MA is flat to moving a little lower though and often a good for quick bounce or two or even a rally if need be.
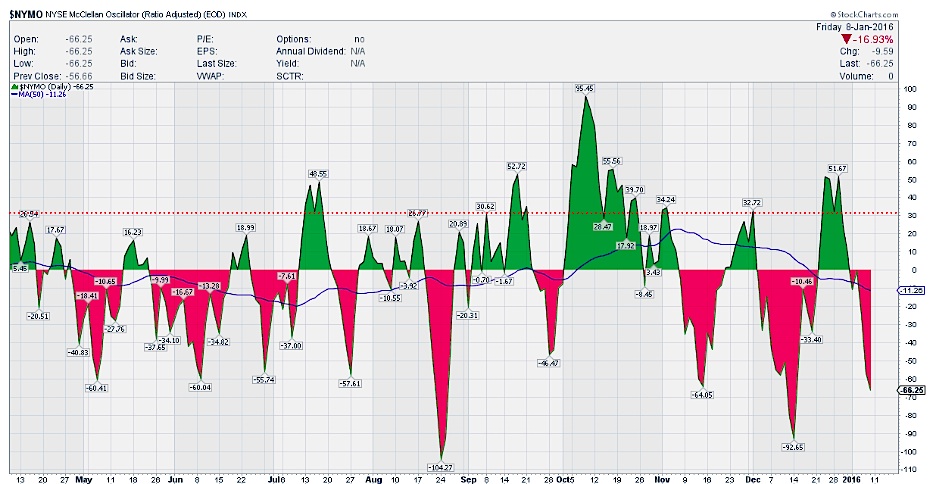
$NYMO – McClellan Oscillator
After some back and forth action from oversold to not being oversold, the McClellan Oscillator is firmly in oversold territory. It finished the week at -66.25. However, it can get more oversold from here before a turn. So keep an open mind.
continue reading on the next page…

: Showing Some Signs of Emerging Strength")
