This past week we saw major stock market resistance levels blown out to the upside. Like many, I expected this rally to stall around the 200 day moving average. But that didn’t happen. Just when it appeared that the 2nd leg of the rally that started in October was starting to peter out or at the very least a pause, stocks moved higher.
There has been a remarkable improvement in the stock market breadth readings since the August lows (or even from March/April timeframe). Right or wrong, central bankers are hard at work to back up their economies and stock market seasonality is transitioning to its most bullish time of year.
It’s also worth noting that there has been a rush to own Large Cap stocks. Just look at big names like Alphabet aka Google (GOOGL), Amazon (AMZN) and Microsoft (MSFT). They all surged after their respective earnings. Even McDonald’s (MCD) made a big move.
The Nasdaq 100 is near its highs again and looks like a leader here.
So what have traders and active fund managers been doing during this run higher?
Well, the “Fear of Missing Out” (FOMO) trade is still working as investors scramble to make money after making a ton of bad trades in the interim. Active fund/investment managers are under invested still. See for yourselves – the NAAIM Exposure Index does show < 70 reading across the board. It remains to be seen though how the big Mutual Funds make adjustments when their fiscal year comes to an end at the end of October.
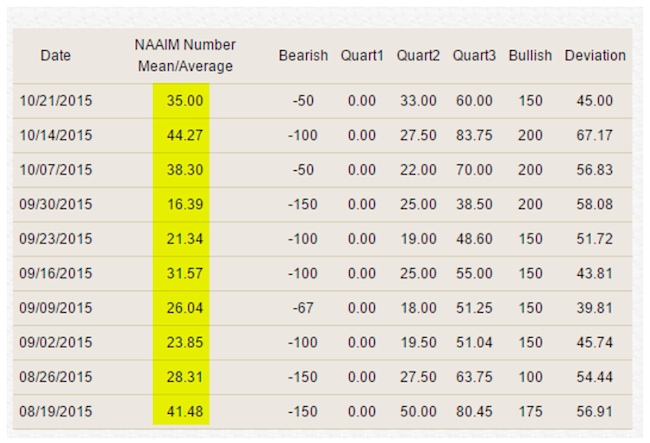
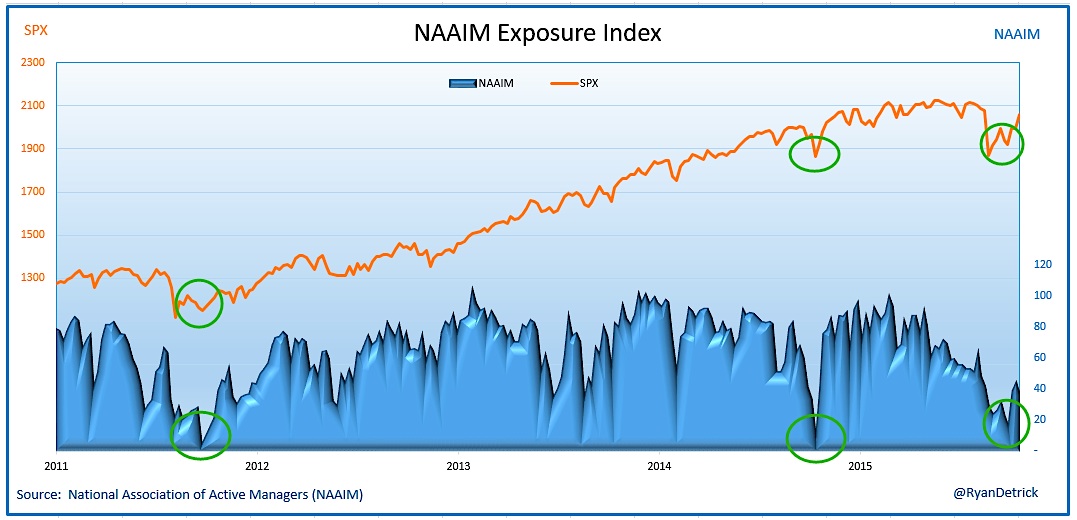
Charts source: NAAIM; Chart above NAAIM Exposure Index – Courtesy: Ryan Detrick (@RyanDetrick)
There is no dearth of earnings next week: Apple (AAPL), Gilead Sciences (GILD), Starbucks (SBUX), LinkedIn (LNKD), Twitter (TWTR), Bristol Myers Squibb (BMY), United Postal Service (UPS), Buffalo Wild Wings (BWLD), Amgen (AMGN) and Exxon Mobil (XOM) are some bellwethers reporting next week. And if that is not enough, we have a very heavy Economic Calendar with FOMC and GDP reports.
Alright, let’s see what the charts are saying about individual sectors, stock market breadth, and some broader stock market indicators.
BREADTH INDICATORS:
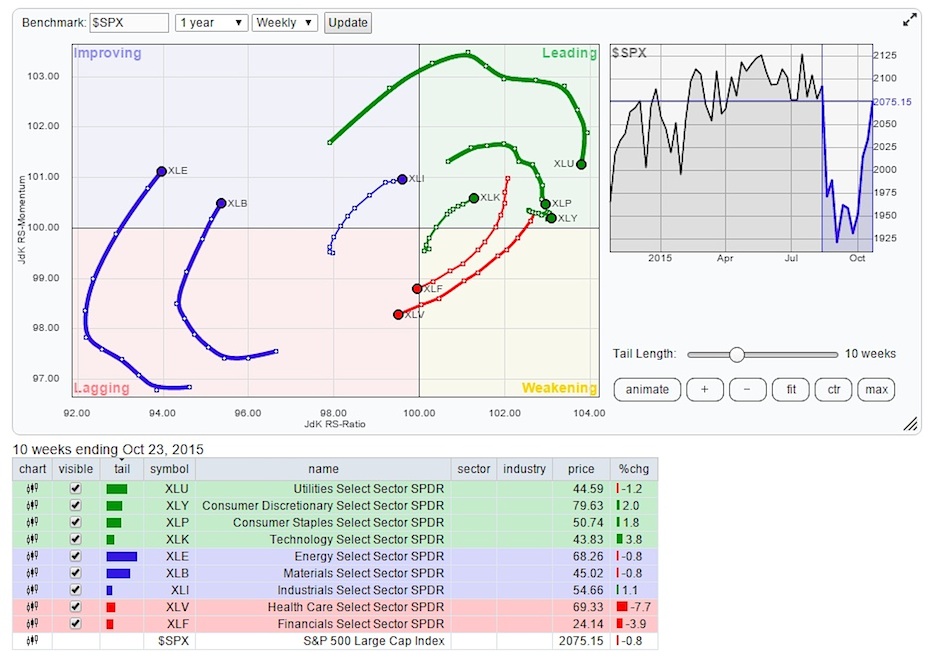
The Relative Rotation Graph (RRG) chart showing the leaders and the laggards among the 9 key stock market sectors.
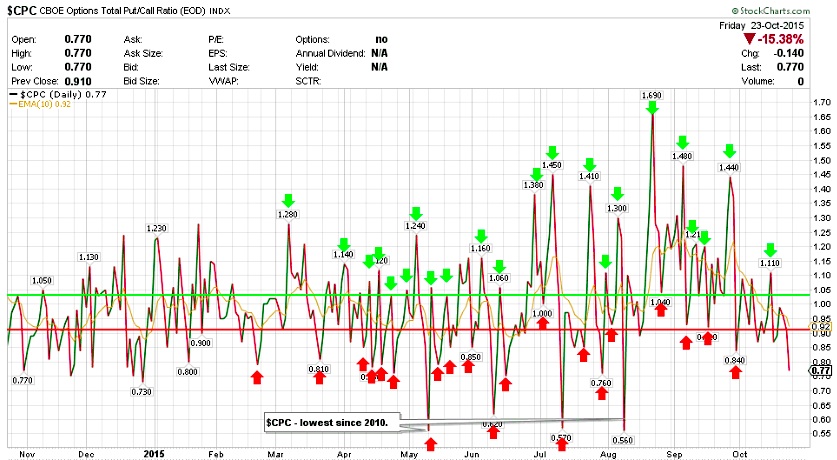
$CPC – Put/Call Ratio:
After being in the range of 1.20-0.80, the put / call ratio ended the week at 0.77. The Equity only Put/Call ratios still remains on a buy signal as it continues to decline.
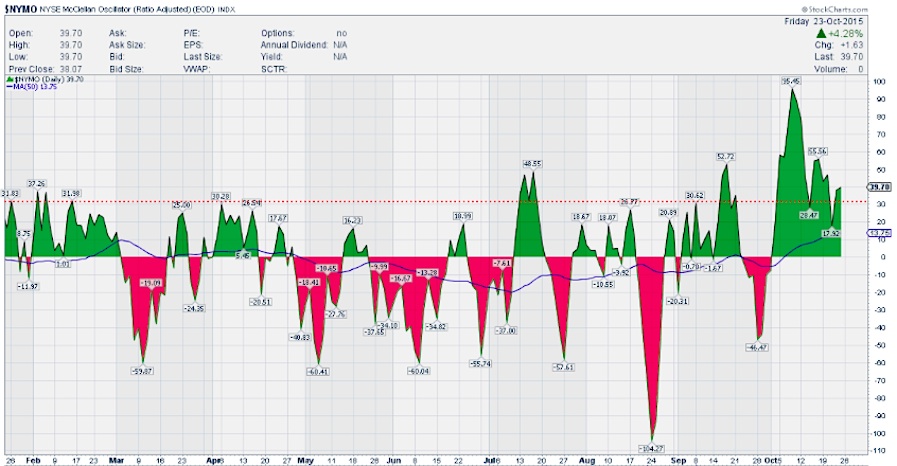
$NYMO (McClellan Oscillator):
At the beginning of the week, with the consolidation in the indices, the McClellan Oscillator (NYMO) continued to work off overbought conditions. However towards mid Wednesday, the McClellan Oscillator started gaining momentum towards the downside, giving some hope for the bears. However the violent turn higher for stocks on Thursday and Friday allowed NYMO to end positive at 39.70. While stocks are overbought near-term and may see a rest (perhaps towards the zero line), overall NYMO remains bullish.
continue reading on the next page…


