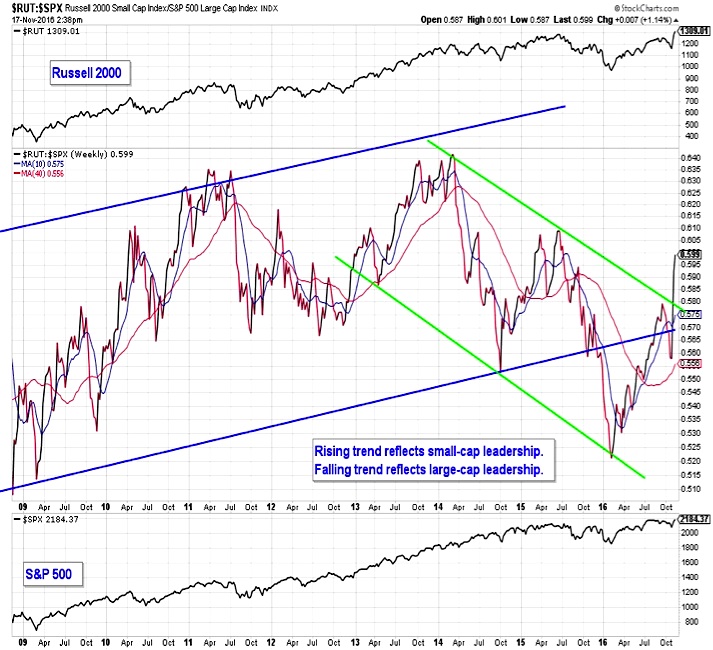
Small Cap Stocks
The initial failure (in October) of the Russell 2000 to break out of the down-trend versus the S&P 500 that stretched back several years led some to suggest that the bounce in small-caps had run its course. A month later, the picture looks totally different. Small-caps are getting back in gear on an absolute and relative basis. The Russell 2000 has moved to a new all-time high and a higher percentage of stocks on the small-cap S&P 600 are trading above their 50-day averages than is seen on the S&P 500 (78% versus 57%). The seasonal pattern that argued for relative weakness in small-caps ahead of the presidential election suggests strength in small-caps over the course of 2017.
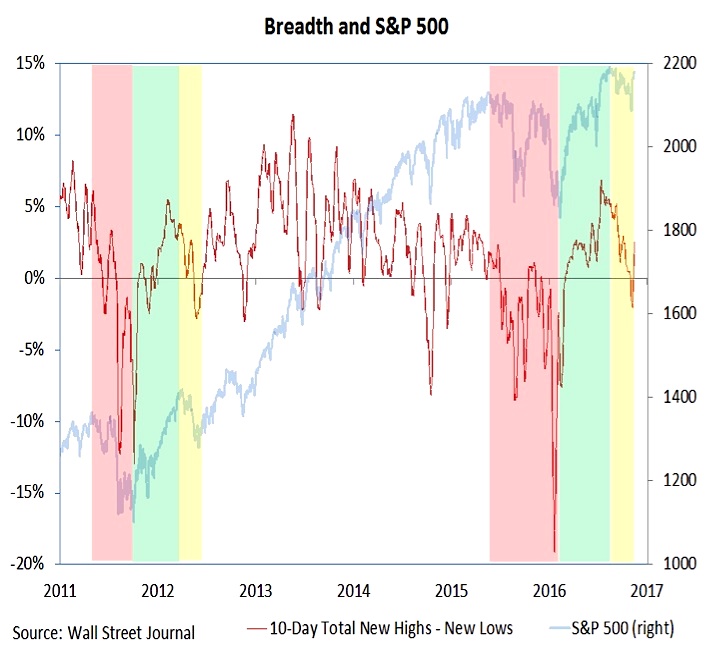
Market Breadth Indicators
The improvement has not yet been sufficient to merit an upgrade in our view of breadth (still neutral), but it is encouraging, especially in the face of rising investor optimism.
The trend in net new highs continues to follow the pattern that emerged in 2011-2012. This even includes the surge in new NYSE lows earlier this week due to bond-like instruments that trade on that exchange. The NASDAQ this week saw the most new highs in over a decade, and the S&P 500 had nearly 20% of its stocks making new highs on two occasions recently.
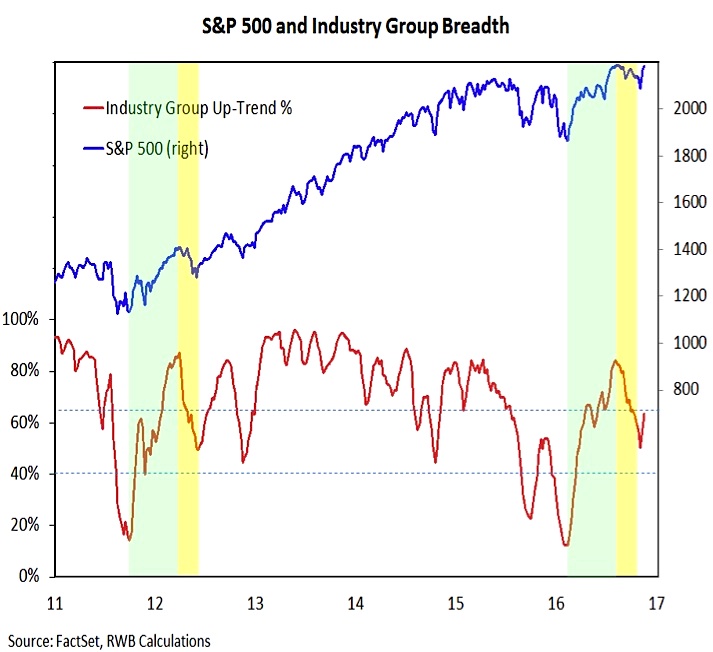
Industry group trends have also turned higher. After bottoming at just 50% of groups in up-trends (consistent with the low seen in early 2012), this indicator expanded to 57% at the end of last week and based on preliminary data (included in the chart to the left) could get back to 63% at the end of this week. A cross above 65% has typically signaled that breadth is back to being bullish.
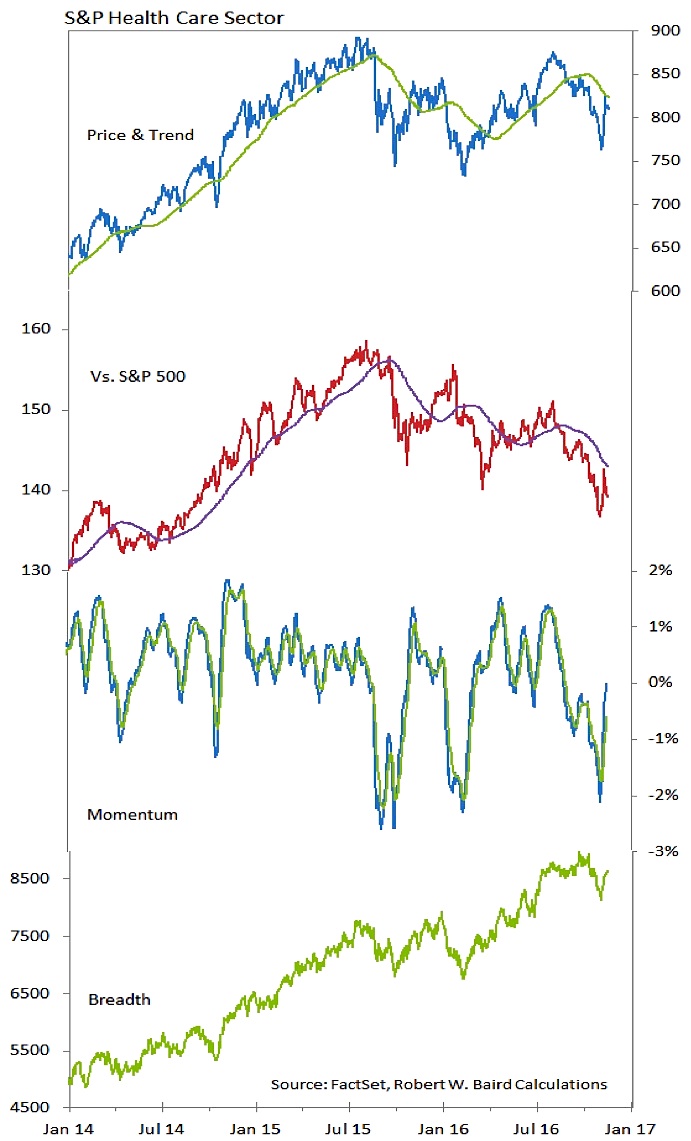
Sector Focus: Health Care
Healthcare trails only Industrials and Financials for month-to-date performance. While those two sectors have built on recent relative strength and have moved to new highs, Health Care has been a relative laggard, with the November bounce coming off of new relative lows. While momentum continues to improve, the gains in both absolute and relative price have stalled. It is too early to conclude that this month’s strength is anything more than relief from an oversold condition. More evidence needs to be seen.
Thanks for reading.
Twitter: @WillieDelwiche
Any opinions expressed herein are solely those of the author, and do not in any way represent the views or opinions of any other person or entity.
 – Warren Buffett’s Biggest Holding!")


 – Warren Buffett’s Biggest Holding!")
 May Tip Stock Market’s Next Move")