Weekly Technical Review And Stock Market Outlook November 18
Here’s a look at some key stock market indicators and emerging themes that we are watching in our research:
Sentiment Showing Relief Or Optimism? – The sentiment surveys this week showed renewed bullishness. After the excessive (albeit short-lived) pessimism that emerged prior to the presidential election, it is too early to get good sense about whether we are seeing investor relief or investor optimism. While some specific sectors of the stock market are seeing inflows, equity mutual funds and ETF’s overall are not.
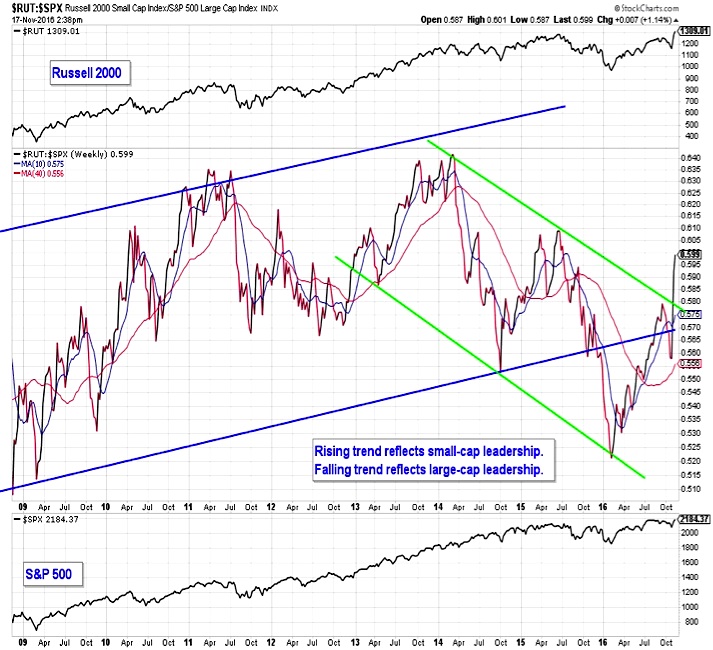
Small-Caps Back In The Lead – The Russell 2000 Index (INDEXRUSSELL:RUT) stumbled in October, but this was consistent with the typical pre-election pattern. Consistent with the typical post-election pattern, small-caps have rebounded sharply, with the Russell 2000 moving to a new all-time high ahead of the S&P 500 Index (INDEXSP:.INX).
Market Breadth Headed In Positive Direction – While not yet back to a bullish mode, market breadth continues to improve. The number of stocks making new highs has expanded (the NASDAQ this week saw the most new highs on a single day in over a decade) and the percentage of industry groups has turned sharply higher.
Stock Market Indicators
Investor Sentiment
A review of this week’s sentiment surveys shows a pronounced up-tick in investor optimism. Bears, however, are not yet in total hibernation.
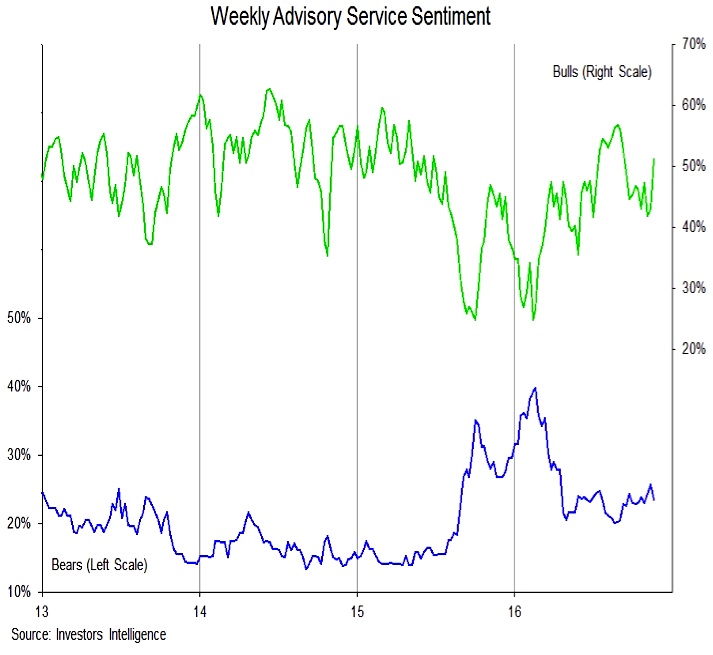
The Investors Intelligence survey of advisory services showed bulls rising from 42.9% to 51.0%. Bears slipped only slightly, dropping from 25.7% to 23.5%. On this survey, there are both fewer bulls and more bears than were present earlier this year.
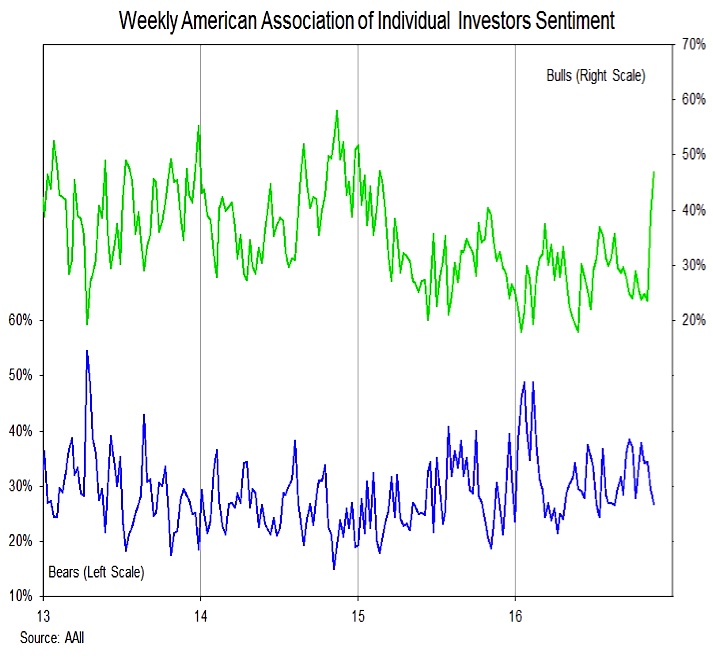
In terms of optimism, the AAII survey of individual investors shows a much more dramatic shift. Bulls rose this week from 38.9% to 46.7% and have essentially doubled over the past two weeks. This is the highest level of bulls since February 2015. Bears have dropped from 42.1% to 26.8% over the past two weeks, but remain above the lows that were seen earlier this year.
On both the AAII and Investors Intelligence surveys, bull readings in the upper 50’s and/or bear readings below could signal excessive optimism.
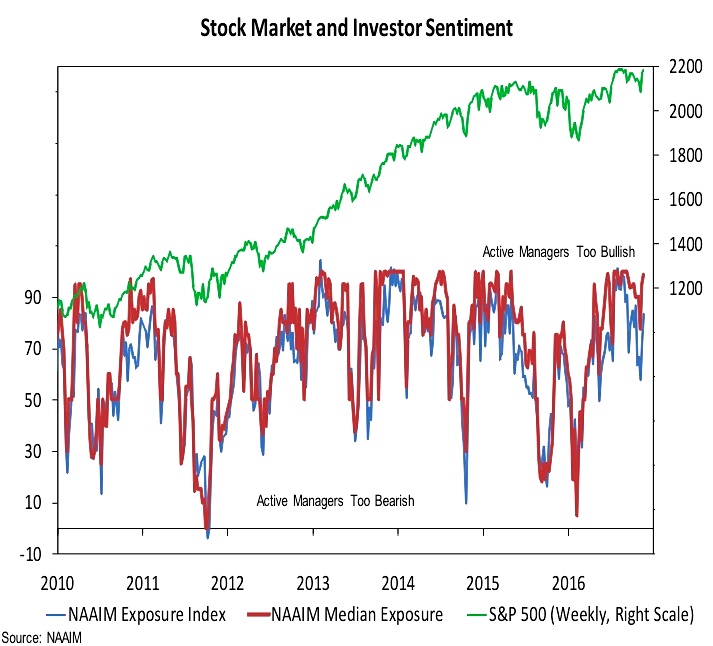
Active investment managers have moved back to being too bullish, although this indicator offers better signals of excessive pessimism than it does excessive optimism (especially with the improved tone from the broad market). The exposure index rose from 73% to 83% this week and median exposure ticked up from 95% to 99%.
Two notes about sentiment going forward. Seasonal patterns shows that optimism tends to be elevated going into year-end, so higher-than-normal levels of bullishness may be necessary to signal excessive optimism. But this is offset by rising interest rates, which typically lowers threshold for what is needed to signal excessive optimism.
continue reading on the next page…


