June 3rd Stock Market Outlook and Technical Review
Here’s a look at some key stock market indicators and emerging themes that we are watching:
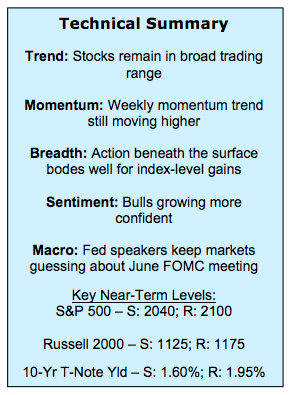
Beneath Surface, Improvements Accumulating – The S&P 500 continues to flirt with 2100 or perhaps the problem is that the S&P 500 has committed to a long-term relationship with this level. Either way, beneath-the-surface conditions continue to improve. Small-caps and equal-weight indexes are making progress and sector trends have broken out to the upside.
Investor Sentiment Surveys Show Bounce in Optimism – Weekly swings in investor sentiment surveys continue to generate a buzz. This week saw a build in optimism. The AAII and Investors Intelligence surveys both showed a move from neutral/correction and into the bullish camp. Bulls are now near their April peaks. The NAAIM index moved higher as well, but at 69% is still shy of the 82% seen in April.
Amid the Noise, Sentiment Composites Offer More Clarity – Rather than hanging our hat on any single survey, our preferred approach is to place more weight on the sentiment composites that aggregate survey and other data. These show rising optimism, but nothing excessive.
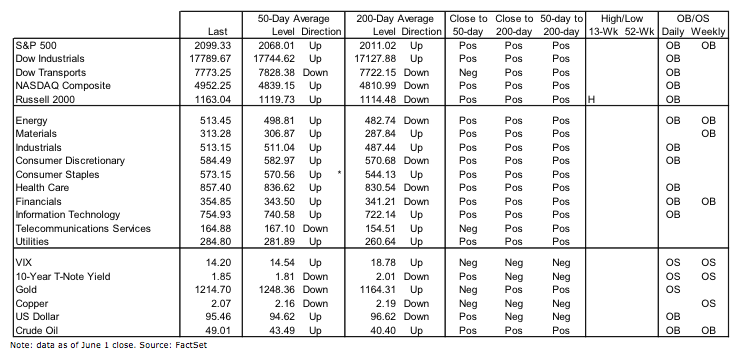
Stock Market Indicators – Indices & Sectors (click to enlarge)
S&P 500 Index
The 2100 level on the S&P 500 remains stiff resistance. Momentum has turned higher, but is well shy of the peaks that led to previous tests of this level (in April and November). On the other hand, the current test enjoys more trend support, as the 50-day average is well above the 200-day average (and the 200-day has turned higher). For now, we continue to look for evidence to suggest the S&P 500 could breakout to the upside or perhaps test support near 2040.
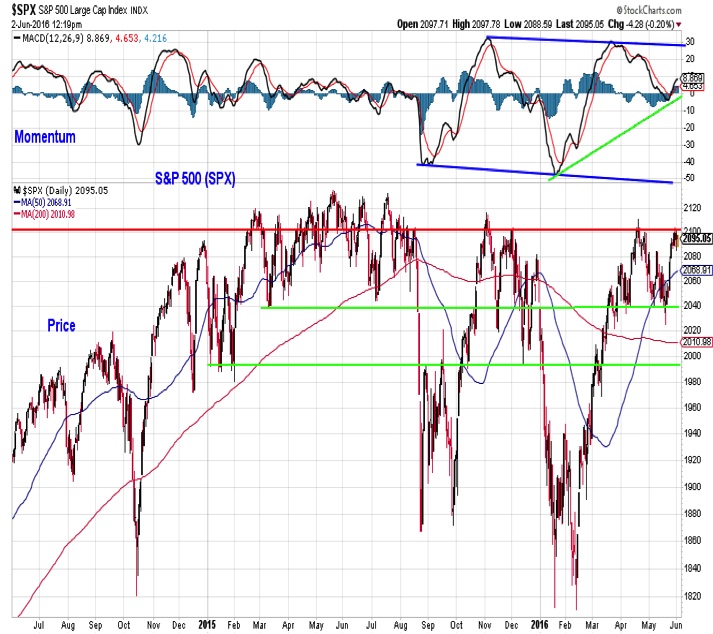
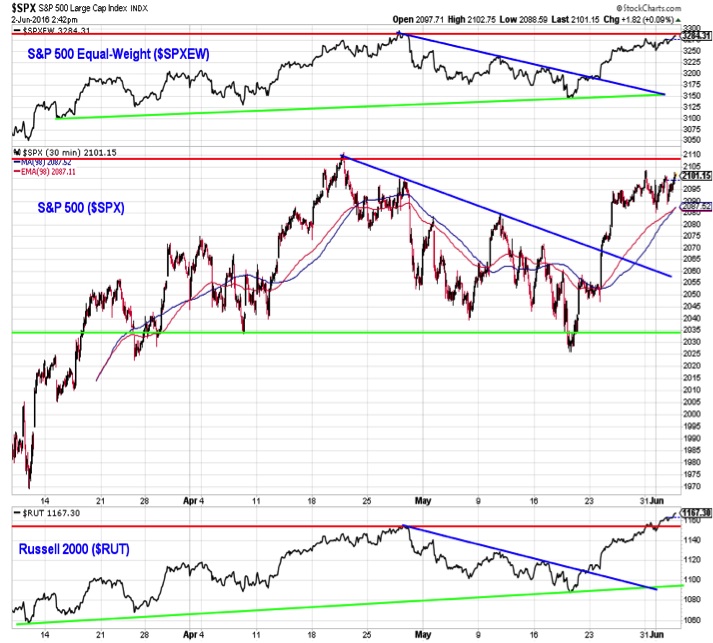
Beneath the surface, however, conditions are showing some improvement for stocks. While the S&P 500 has moved in a sideways range over the past two months, both the Russell 2000 and the S&P 500 equal-weight index have made a series of higher lows. The Russell 2000 is even now making a higher high and small-cap stocks are scarcely lagging their large-cap brethren in a year-to-date basis.
Sector Trends
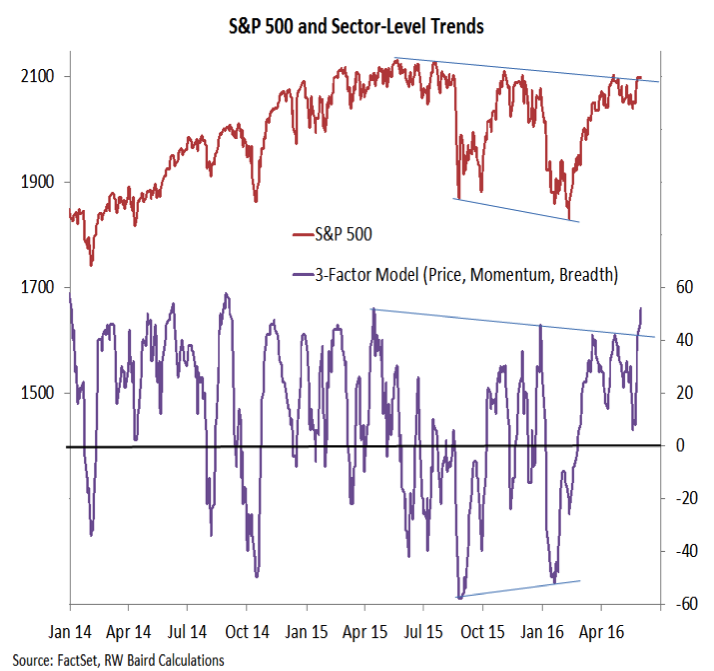
Additional evidence of improvement comes from our sector-level trend indicator. This indicator, based on price, momentum and breadth trends for the S&P sectors, has broken out to the upside. This breaks a pattern of lower highs and indicates that at the sector level most areas of the market are moving higher in harmony.
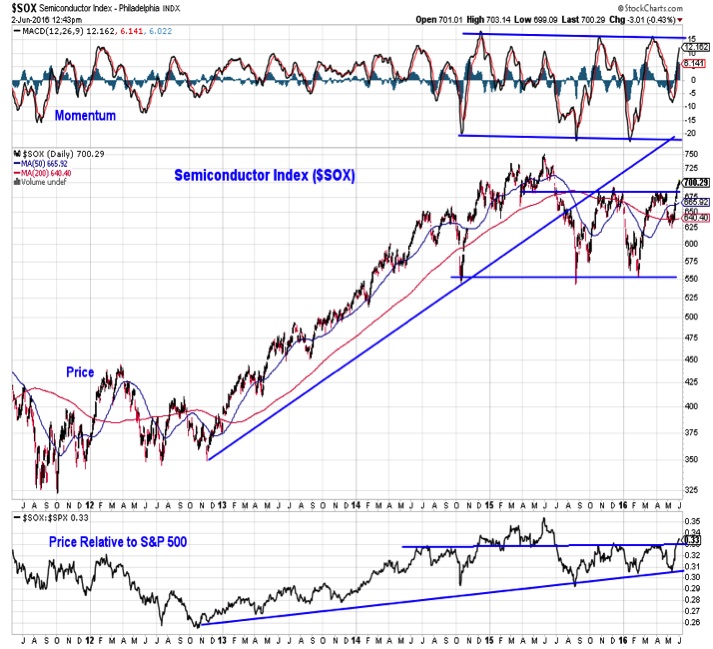
Semiconductors are getting back in gear, with the Philadelphia Semiconductor index (SOX) breaking out to new highs for 2016 on both an absolute and relative price basis. While it is premature to argue the resumption of the up-trend in the SOX, the relative price line has held support and it may signal the consolidation phase in place for the past two years may have run its course.
continue reading on the next page…


