May 20 Stock Market Outlook and Technical Review
Here’s a look at some key stock market indicators and emerging themes like sector leadership that we are watching:
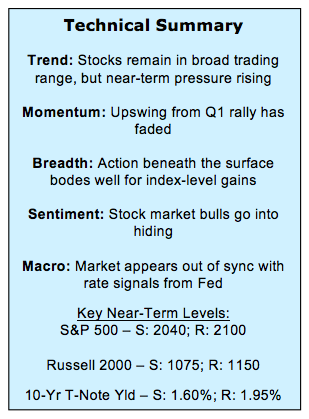
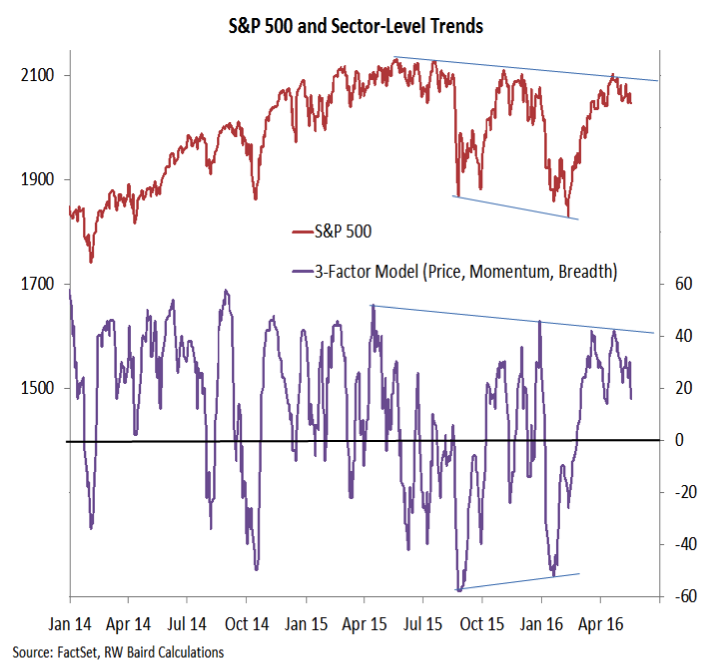
Near-Term Price Trends Weakening – While the trading range of the past year-plus remains intact, the near-term price trend for the S&P 500 is weakening as the index has seen lower highs and lower lows over the past month. The Russell 2000 continues to lose ground relative to the S&P 500 and now sector-level trends are showing some deterioration.
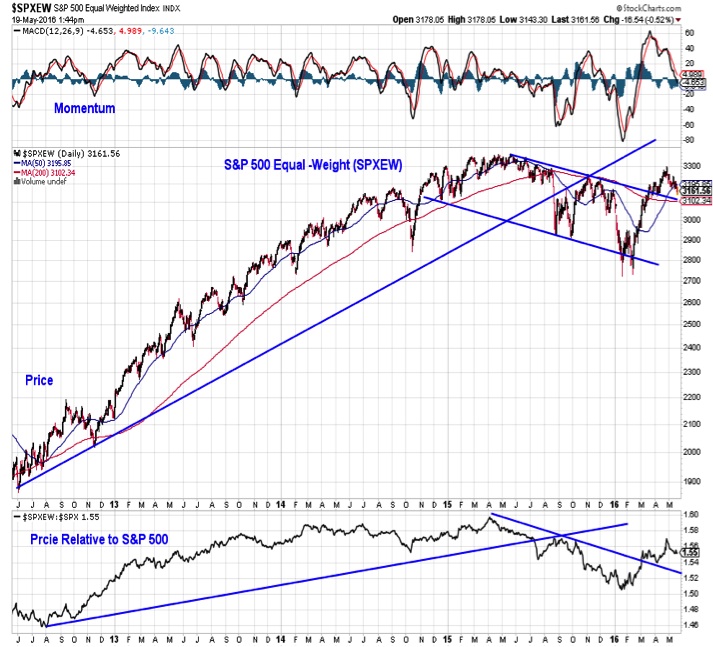
Average Stock Holding Up Better Than Popular Averages – While sector-level trends have weakened, breadth continues to hold up relatively well. (This may bode well for stocks looking further out). In fact, the S&P 500 equal-weight index has continued to improve relative to the S&P 500. Another way to think about this: the S&P 500 has not made a new high in almost a year, while last week saw the most NYSE issues making new highs since February 2015.
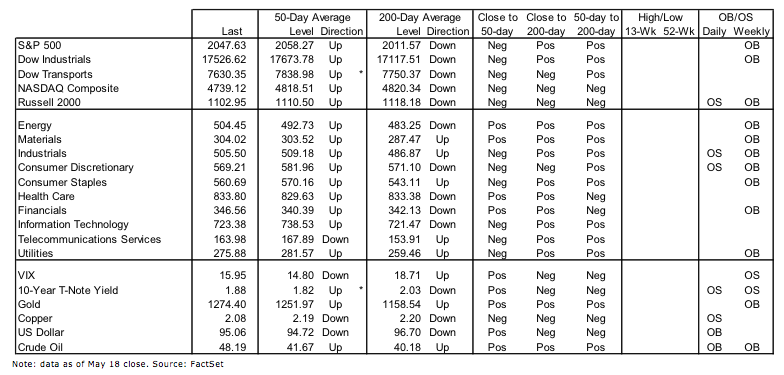
Sector Leadership Trends Under Pressure – Our sector-level rankings have been in flux as old sector leadership trends fade and new ones emerge. Utilities have retained the benefit of the doubt versus Energy, but they are at important support. A shift from defensive to more cyclical sector leadership would seem to be good for the market overall. Also encouraging are the nascent signs of improvement coming from the Financials sector.
Stock Market Indicators – Indices & Sectors (click to enlarge)
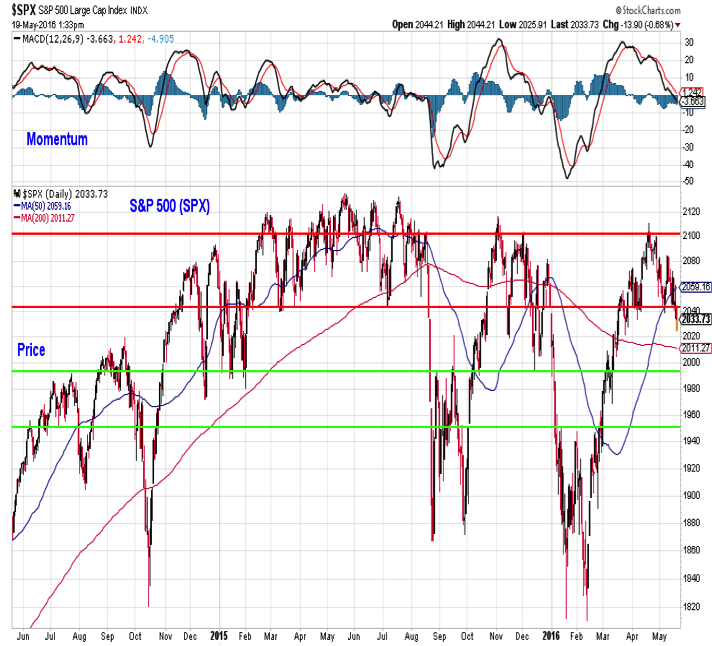
S&P 500 Index
A longer-term trading range is still intact for the S&P 500 as it has recently traded where it began 2016 and 2015. Shorter-term, 2100 has remained as formidable resistance and since mid-April, the index has made a series of lower highs and lower lows, by definition a down-trend. So far, support near 2040 has been holding. If this fails, a test of the 200-day average (near 2010) seems likely, although more significant support may be just below 2000.
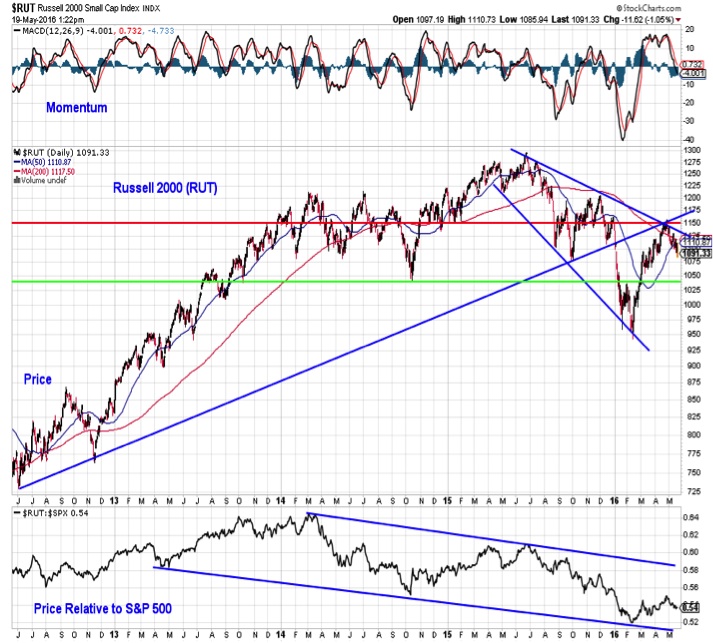
Russell 2000 Index
The “trading range” talk that has been appropriate for the S&P 500 does not apply to the Russell 2000. Small-cap stocks struggled to rally in the second half of 2015, but really got out of gear during the early-2016 swoon. They have been losing ground to large-caps since early 2014, moving lower within a well-defined down-trend channel.
Stock Market Breadth & Trends
Our sector-level trend indicator made a higher low during the early 2016 sell-off, and has since helped pace the rally in the S&P 500. Sector-level trends have not, however, broken out to the upside (helping keep our overall assessment of breadth at neutral), and now this week we have seen some additional faltering from this indicator. This could mean a further near-term pullback for the S&P 500.
We continue to be encouraged by the relative strength being seen by the average stock. The S&P 500 equal-weight index has decisively broken above a down-trend channel and is now consolidating with that former resistance line providing support. Relative to the cap-weighted S&P 500, the equal-weight index has moved steadily higher since bottoming early this year.
continue reading on the next page…


 Pressuring Lower Price Support")


 Pressuring Lower Price Support")