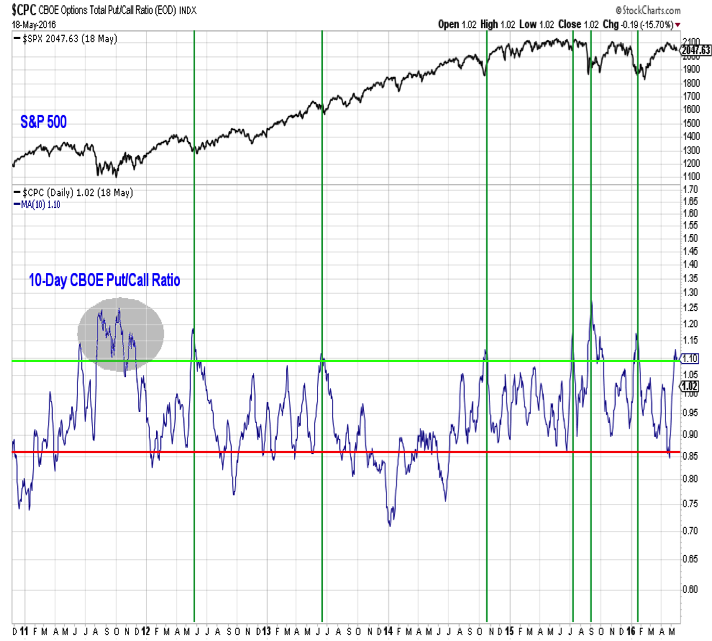
Market Sentiment
Most of the sentiment indicators show a decline in optimism but not necessarily excessive pessimism. Put/call ratios, however, have shown a significant increase in pessimism. The 10-day CBOE put/call ratio has moved above 110%, as demand for puts has expanded as stocks have consolidated. Since 2012, readings this high have tended to come at or near short-term bottoms for the S&P 500.
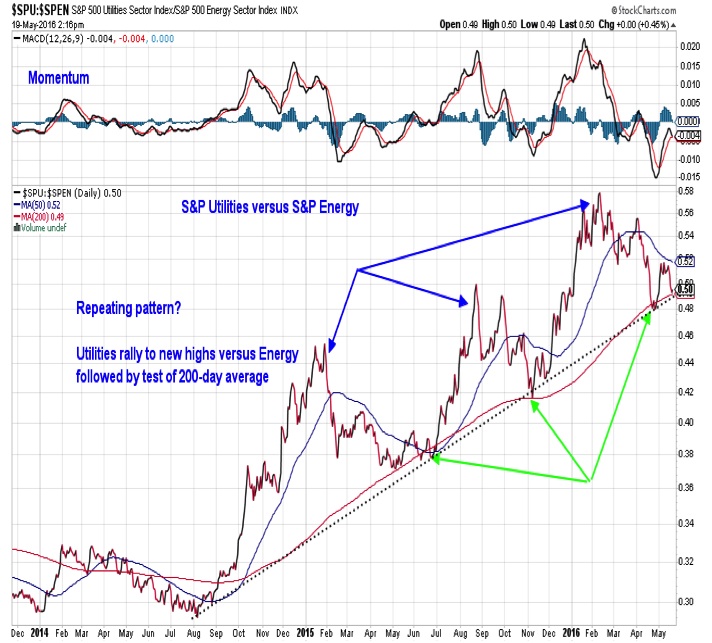
Utilities Sector vs Energy Sector
We showed this chart of the ratio between the Utilities and Energy sectors a month ago and thought it would be appropriate to re-visit it now. So far, the previous pattern has continued to hold and the long-term trend favoring Utilities over Energy has not broken down. After an initial bounce, however, it is again testing support. A clear break-down could signal a transition out of the defensive sector leadership environment seen since late 2014.
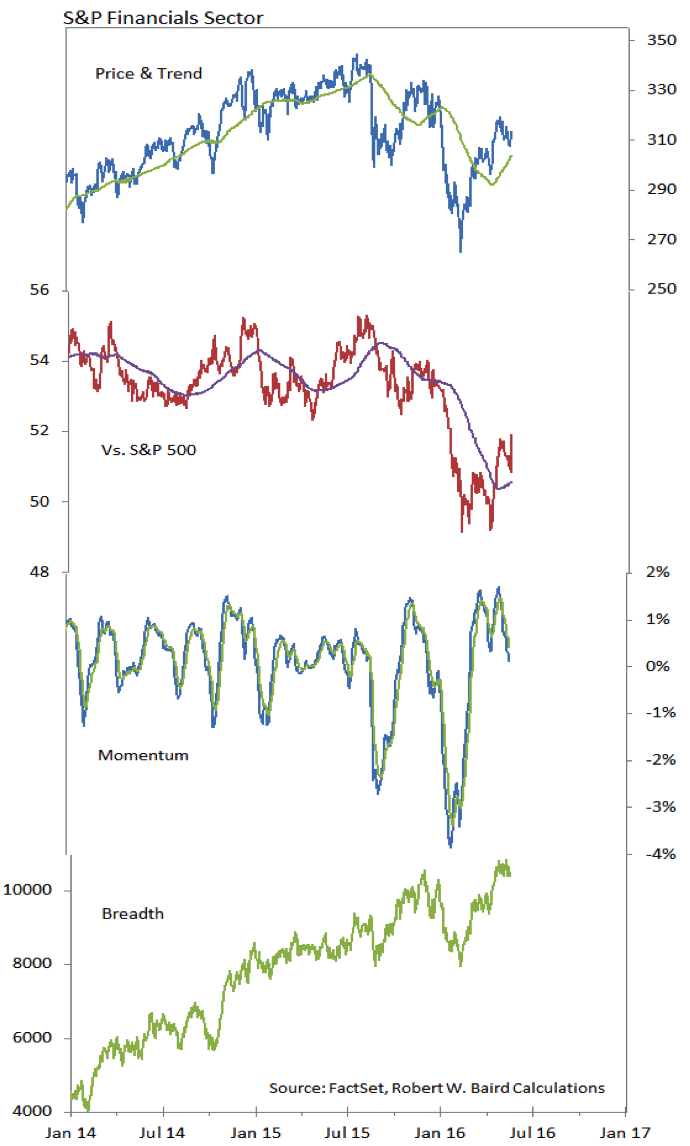
Financials Sector
For the past few weeks we have noticed a large number of sub-industries in the Financials sector showing improving relative strength trends. While not yet showing up as clear relative strength leadership at the sector level, the trend there is improving as well. Strong breadth within the sector, as well as the aforementioned sub-industry improvement, may support further strength in Financials. Sector leadership from the Financials sector has historically been bullish for the stock market overall.
Thanks for reading.
Twitter: @WillieDelwiche
Any opinions expressed herein are solely those of the author, and do not in any way represent the views or opinions of any other person or entity.
")


 Rolling Over At Key Fibonacci Level?")
