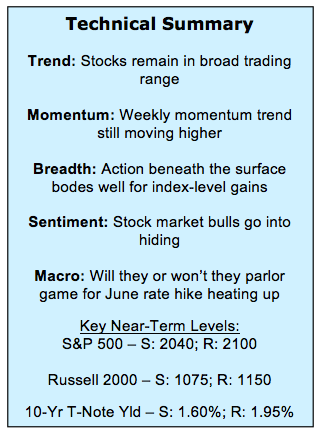
May 27 Stock Market Outlook and Technical Review
Here’s a look at some key stock market indicators and emerging themes that we are watching:
Right Back to Where We Were, but Not Feeling Good About It – The S&P 500 is back to where it was in late April. The sentiment backdrop, however, is quite different. A month ago, Investors Intelligence showed 47% bulls – it now shows 35%. Then, AAII bulls were at 33% – now it is almost half that, at 18%. Then the NAAIM Exposure index was in the 80s – now it is in the 60s.
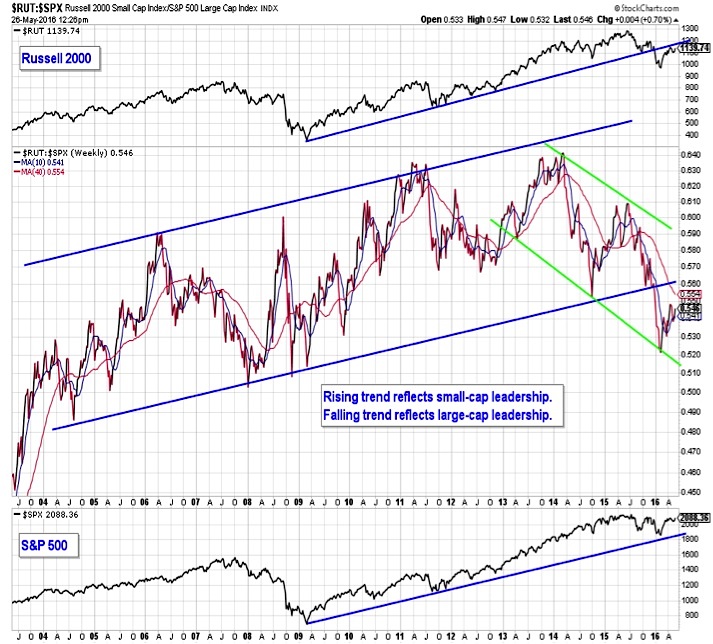
Small-Caps Have Bounced, but Trends Unchanged – The rally off of the early year lows still leaves the Russell 2000 below its long-term trend-line, and the ratio between small-caps and large-caps does not suggest an imminent return to sustained small-cap leadership in the stock market.
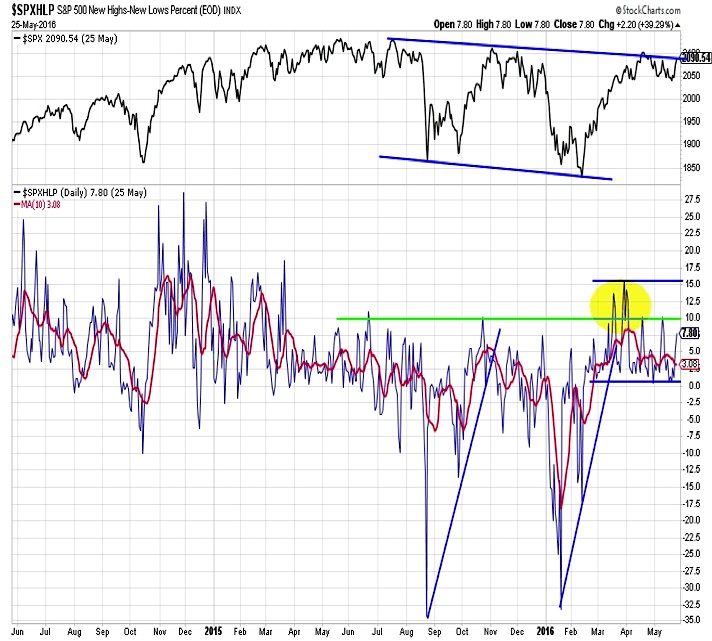
Looking for Evidence That Something Is Changing – We don’t yet have evidence that stocks are breaking out of the more-of-the same trading range environment that we have found ourselves in. A few things worth looking for: an expansion in issues making new highs, sustained strength from broker/dealers or perhaps a breakout in interest rates.
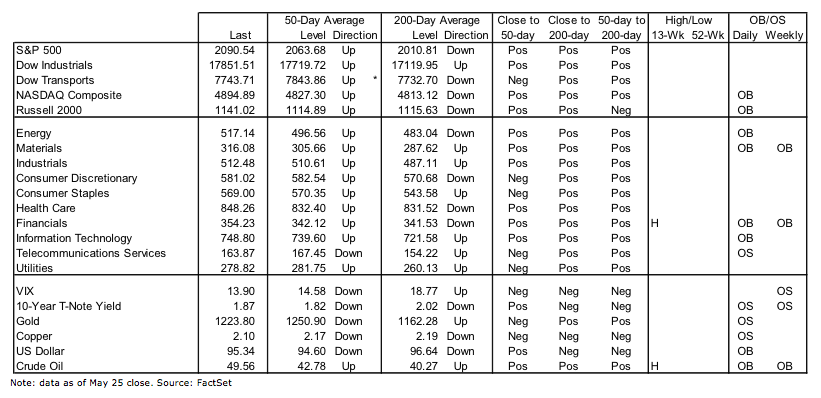
Stock Market Indicators – Indices & Sectors (click to enlarge)
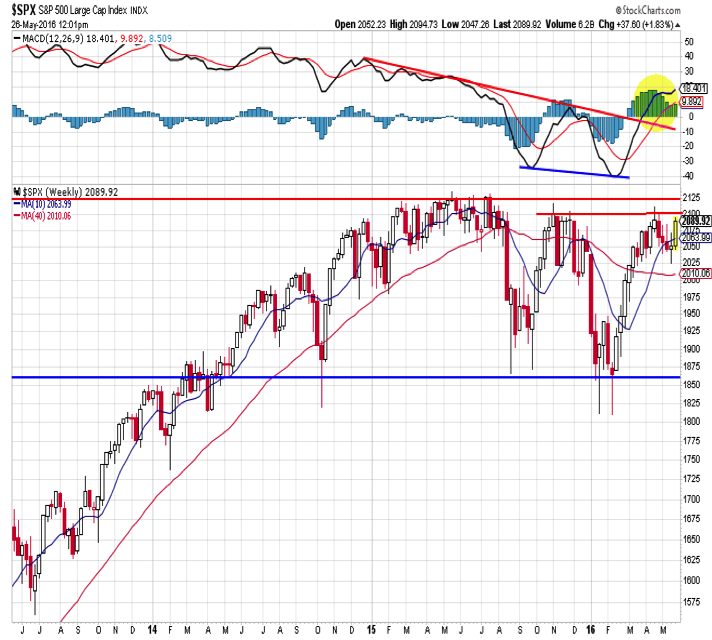
S&P 500 Index
The S&P 500 has held support near 2040 and is again testing resistance near 2100. While the sentiment surveys may not show much outright pessimism, optimism is certainly more muted than it was in April. We have also seen a surge in investors willing to admit that they do not know. AAII “Neutrals” represented more than half of the respondents in this week’s survey and are at the highest level in 26 years. Also, price momentum continues to move higher, which is a potentially bullish divergence.
Russell 2000 Chart
We continue to take a cautious view toward small-caps (if you want to get away from cap-weighted large-caps, we would look at either equal-weighted large-caps or perhaps mid-caps). The Russell 2000 has bounced on an absolute and relative basis, but there is little evidence of the re-emergence (or persistence) of a sustainable up-trend.
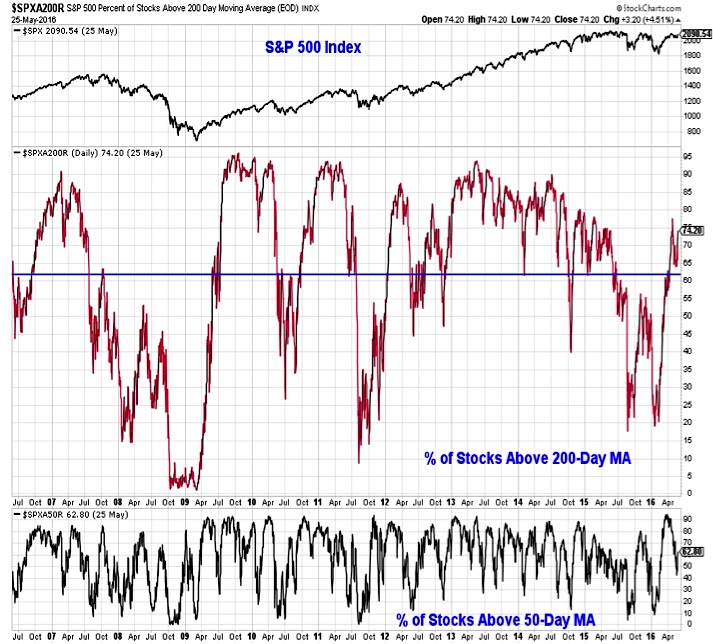
Market Breadth
One reason for encouragement is that breadth has been relatively robust even as the S&P 500 has gone nowhere over the past month. While we did see some deterioration in sector-level trends, those trends remained generally positive. Additionally, the percentage of industry groups in up-trends has not declined sharply and the percentage of stocks in the S&P 500 trading above their 200-day averages is again expanding.
Evidence that the current test of resistance will yield to a sustained breakout could come in the form of an expansion in the number of stocks making new highs. Rallies over the past year (during which time the S&P 500 overall has gone nowhere) have seen no more than 10% of stocks making new 52-week highs (with brief exception in the first quarter of this year). If this number starts to expand, that could signal the S&P 500 is ready for a sustained leg higher.
continue reading on the next page…


: Showing Some Signs of Emerging Strength")
