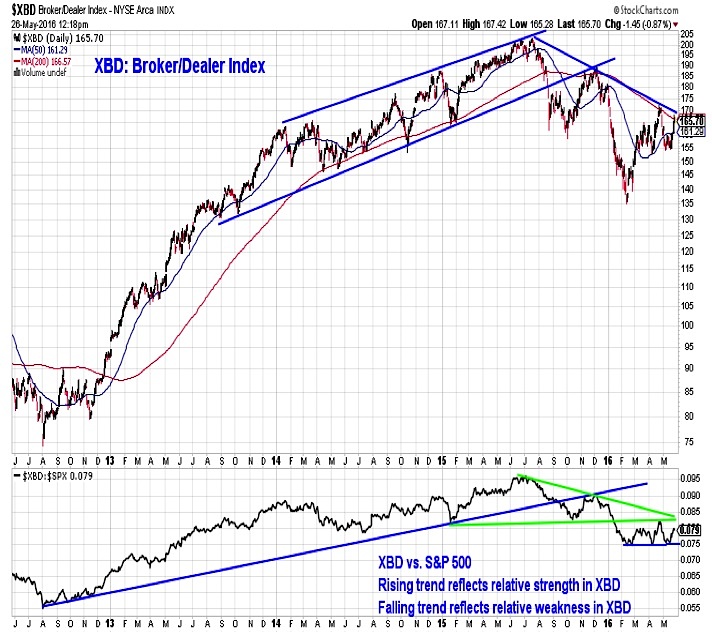
Broker/Dealer Index
Another thing to keep an eye on would be the performance of the broker/dealer index. The XBD is testing downtrends on both an absolute and relative basis. If these resistance levels yield and broker/dealers can continue to rally that too could indicate a breakout of the consolidation phase the S&P 500 has been in for the past year-plus.
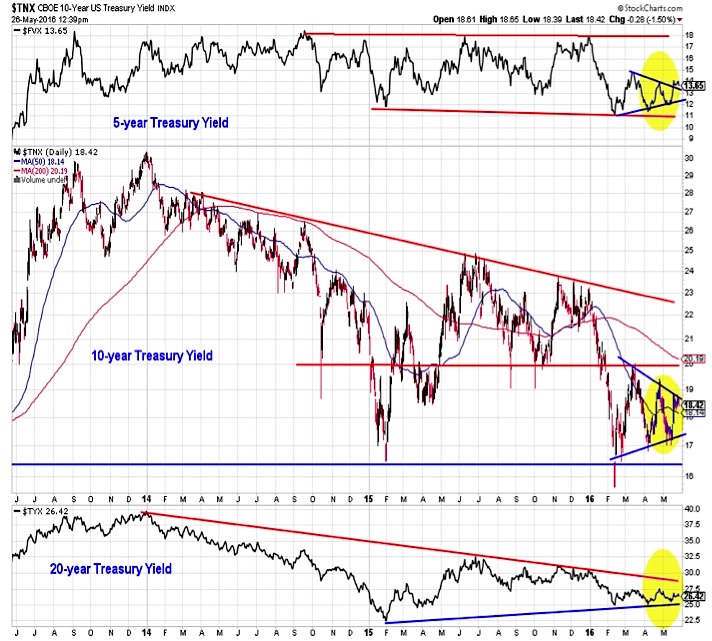
Treasury Yields
We are also watching bond yields. Nothing much has happened yet in terms of upside moves, although down-trends for the 5-year and 10-year T-Note yields are being tested. Also, while not making meaningful upside progress, downside has been more limited. Yields across the curve have been making higher lows. With optimism in bonds still elevated, the crowd seems to be betting that yields cannot continue to move higher.
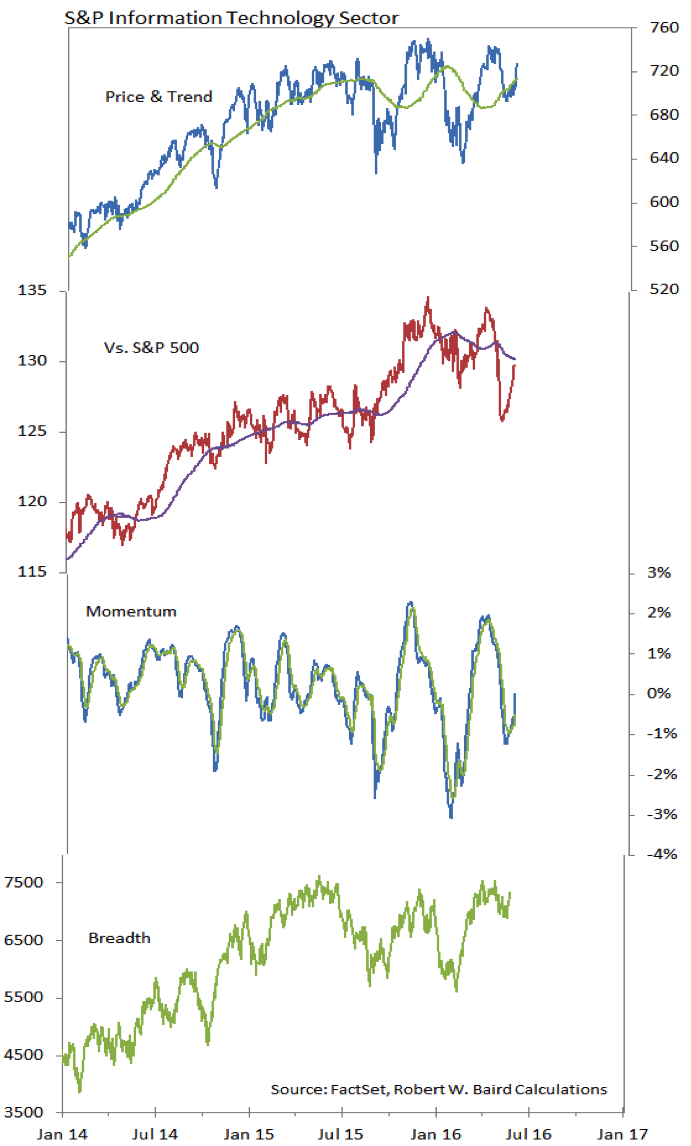
S&P Information Technology Sector
The Technology sector continues to rebound from the big decline in relative strength seen a month ago. With breadth still strong and momentum expanding, the sector could be poised to test the absolute and relative price highs from March.
Thanks for reading.
Twitter: @WillieDelwiche
Any opinions expressed herein are solely those of the author, and do not in any way represent the views or opinions of any other person or entity.


: Showing Some Signs of Emerging Strength")
