What We Are Watching
This Week’s Stock Market Outlook:
Small-Caps Poised for Leadership – Small-cap strength is moving from industry groups and gaining strength relative to their large-cap counterparts. The small-cap stocks dominated Russell 2000 has made a higher high after a higher low and the momentum trend is improving.
Investors Too Excited for Santa – December has a well-deserved reputation for stock market strength, but it is not usually just straight up. The first half of the month can be dominated by tax-loss selling before an upward bias emerges in the second half of the month. With so many investors already looking for Santa Claus, trading could continue to be choppy for stocks.
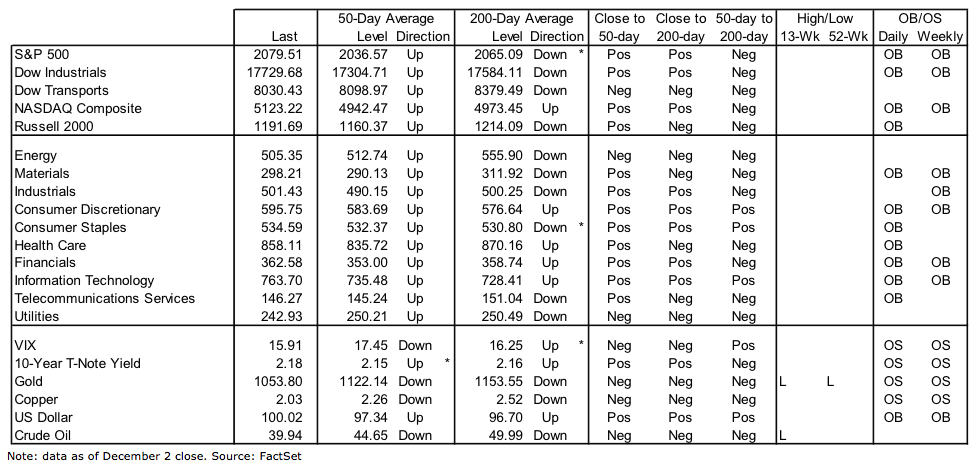
Is Breadth Really That Bad? It’s a popular meme, and there are certainly areas where market breadth could improve (the number of stocks making new highs stands out). Overall, though, market breadth appears to be in fair shape. One example: the advance/decline line for the S&P 1500 has already cleared its early November high and is just shy of a new all-time high.
Stock Market Indicators – Indices & Sectors (click to enlarge)
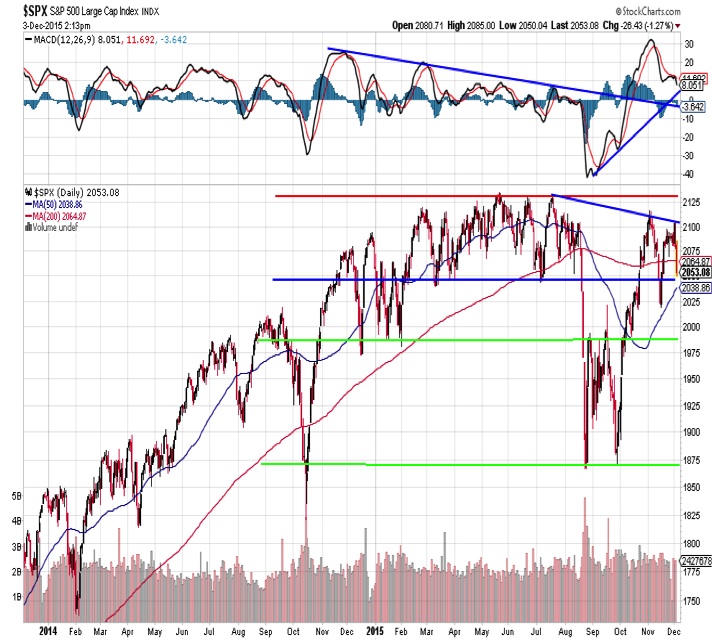
S&P 500 Index
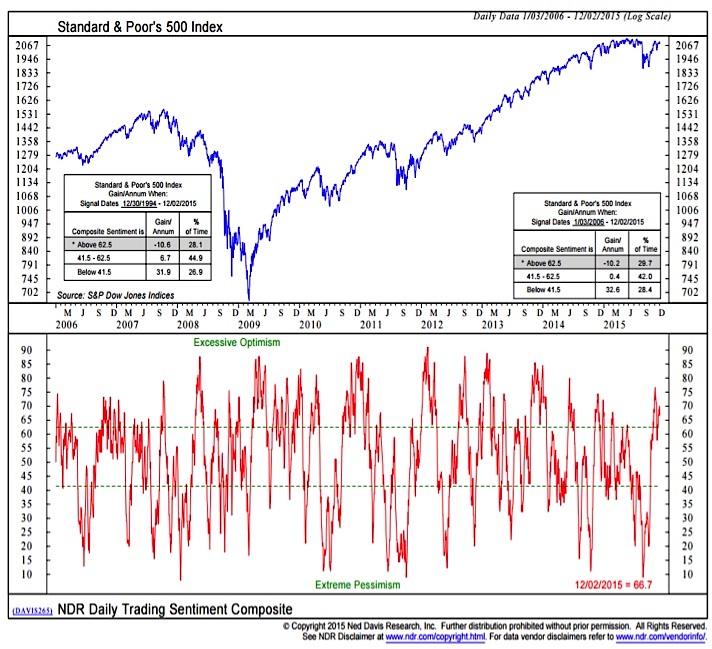
While it mostly looks like we continue to be governed by the support and resistance lines that were traced out over the first half of the year, there is some concern that the S&P 500 has begun to make a series of lower highs. The November stock market pullback found support near the 200-day moving average, which is now just below 2040. On the positive side for stocks, the momentum uptrend remains intact.
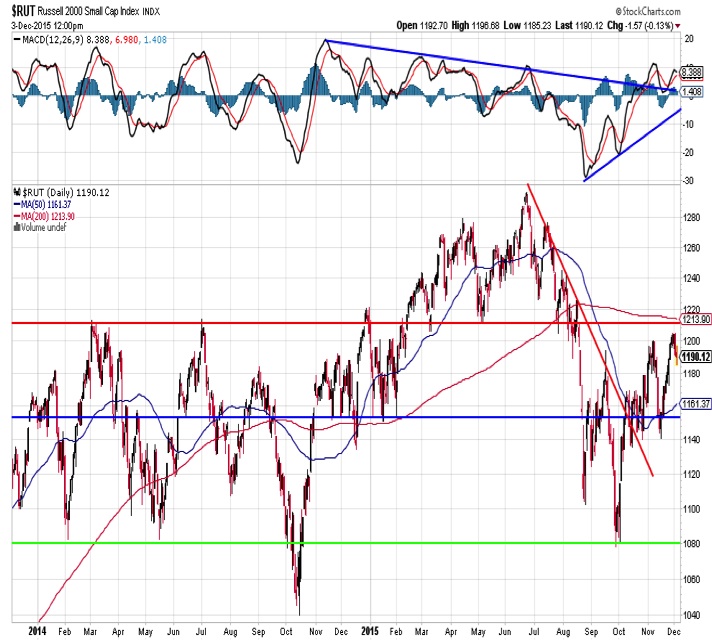
Russell 2000 Index
The small-cap Russell 2000 could be in the process of moving from lagging to leading the S&P 500. The Russell 2000 has already surpassed its early November peak as an up-trend off of the October lows seems to be emerging. The momentum trend is also improving after getting through resistance. Getting above the 200-day moving average (near 1215) would be further evidence that small-cap market seasonality (and leadership) has emerged, but the setup is encouraging right now.
Market Sentiment
Our more intermediate-term market sentiment indicators are generally neutral. Active investors have increased their exposure to stocks, but not excessively so, and neither individual investors nor advisory services are currently showing excessive levels of optimism.
The shorter-term trading sentiment composite from Ned Davis Research, however, is in the excessive optimism zone. We are starting to see the VIX spike and demand for put-options is building, so early month choppiness in stocks could be helping to cool optimistic market sentiment.
continue reading on the next page…


