Market Seasonality
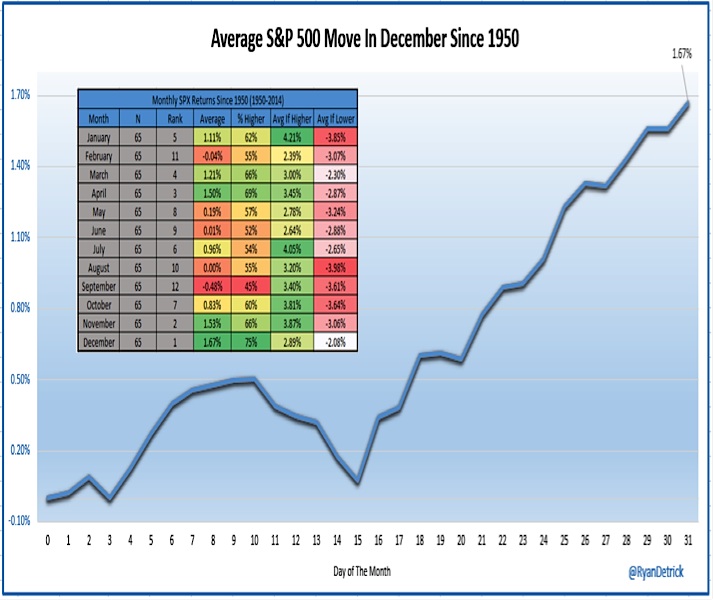
Investors seem to be keying on the summary statistics that show December is the best month of the year for stocks. This hides the fact that market seasonality trends tend to produce a choppy first half of the month (thanks to @RyanDetrick for the use of this chart) and can be dominated by tax-loss selling.
It is not until the second half of the month (usually after stories begin to appear about how Santa won’t be coming) that the upward bias emerges.
While December is getting off to a rough start this year, we don’t have evidence to suggest this year’s pattern will significantly deviate from the norm.
Market Breadth
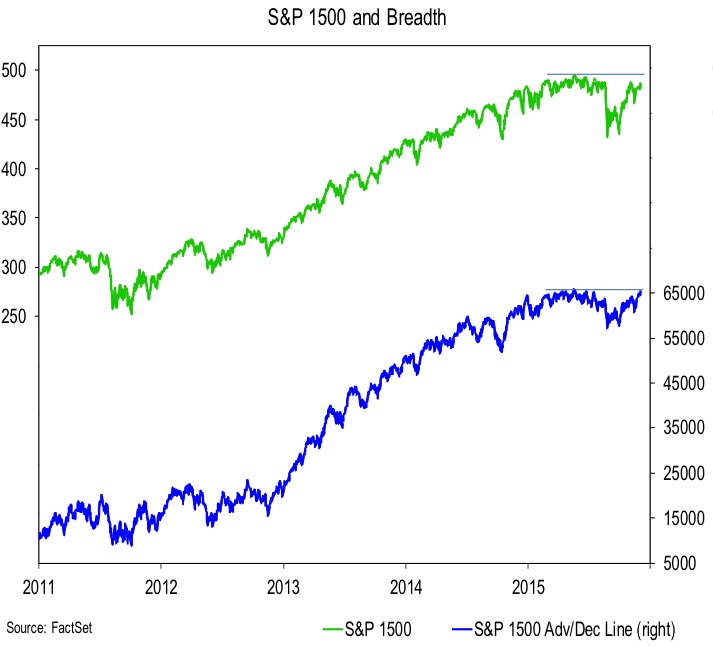
We are not making the case that market breadth has turned bullish – we would like to see a continued increase in the percentage of industry groups in uptrends (currently around 54%). We do, however, believe that concerns about the narrowness of the rally are misplaced.
The advance/decline line for the S&P 1500 is just shy of its all-time high and is actually leading the cap-weighted index.
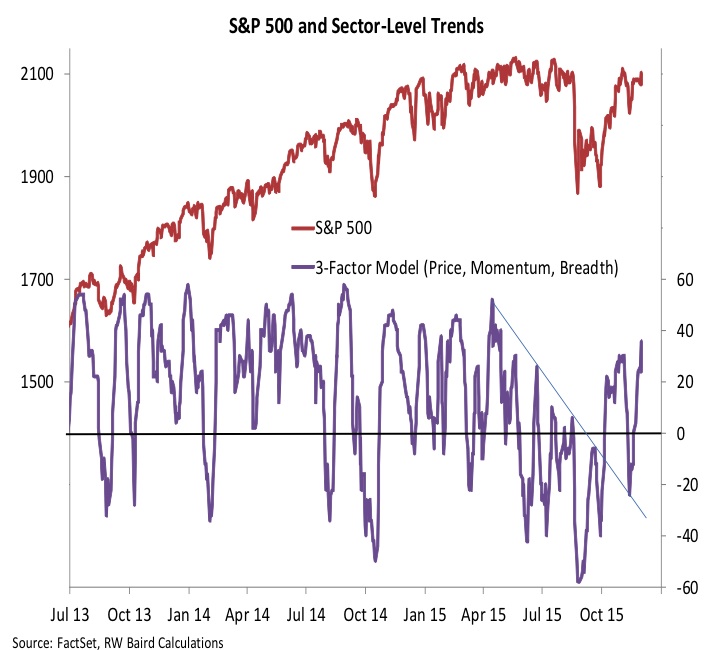
Our sector-level trend indicator (which measures price, momentum and breadth trends for the 10 S&P sectors) has held support at the extension of a downtrend line and a pattern of higher lows and higher highs has emerged.
While maybe not full of vim and vigor, the reports of market breadth’s death have been greatly exaggerated (to paraphrase Mark Twain).
Consumer Discretionary Sector
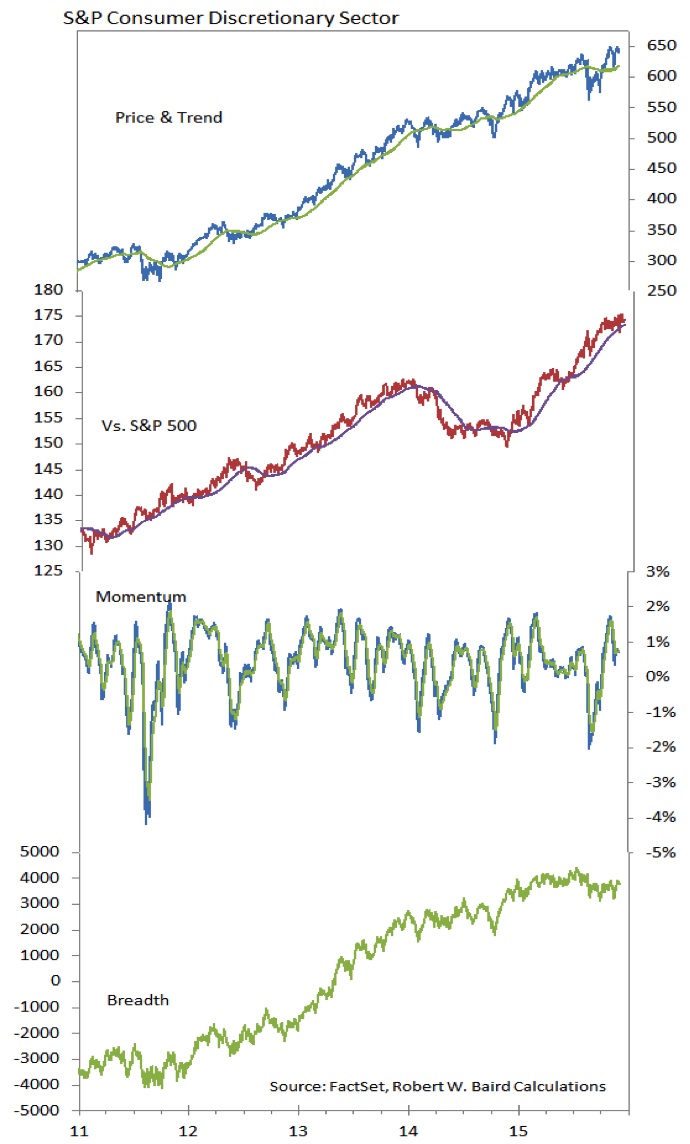
The Consumer Discretionary sector has been the top-performing sector in the S&P 500 this year, and the absolute and relative price trends remain robust. Of some concern is market breadth in the sector has narrowed.
The advance/decline line has not match the price lines in making new highs and the percentage of stocks above their 200-day averages (as of 11/30) was a paltry 35%, ahead of only Energy and Telecom among the sectors. The retailing group has been hit hard and some see this signaling broader weakness for the sector (similar to what was seen in Biotech and the Health Care sector). A deterioration in the relative strength ranking for the Consumer Discretionary sector would suggest this fear is playing out.
Thanks for reading.
Twitter: @WillieDelwiche
Any opinions expressed herein are solely those of the author, and do not in any way represent the views or opinions of any other person or entity.


: Showing Some Signs of Emerging Strength")
