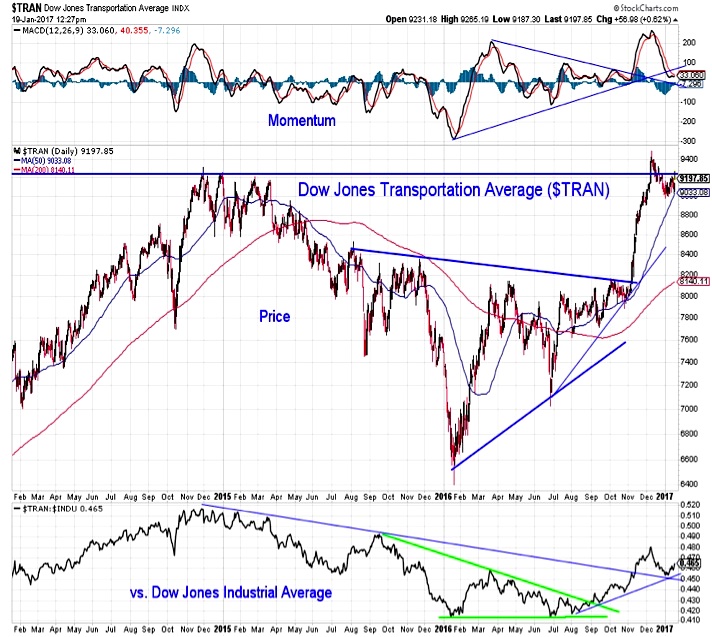
Dow Jones Transportation Average
The Dow Transports are showing evidence of getting back in gear. The index has held support at its 50-day average, and the Transports have moved higher relative to the Industrials so far this year (after losing ground in December). Seeing an upturn in momentum and getting back above the late-2014/early-2015 highs could be evidence that a broader rally is set to resume.
Investor Sentiment
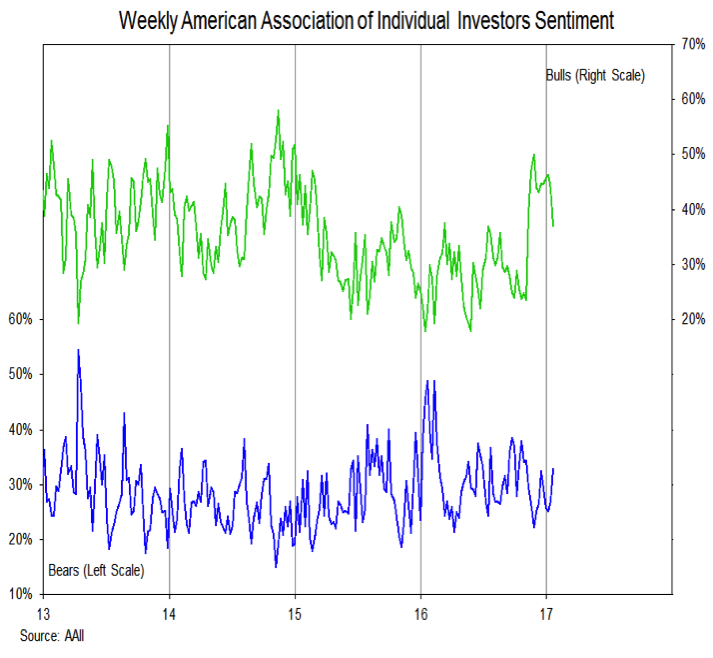
We have been looking for an unwinding in investor optimism to help signal an end to the ongoing consolidation in stocks. Looking at this week’s data on individual investors from the AAII suggests we could be getting that. Bullish sentiment on that survey dropped 7 points and is at its lowest level since prior to the November election, while bearish sentiment rose by a similar amount and is at its highest level since the election.
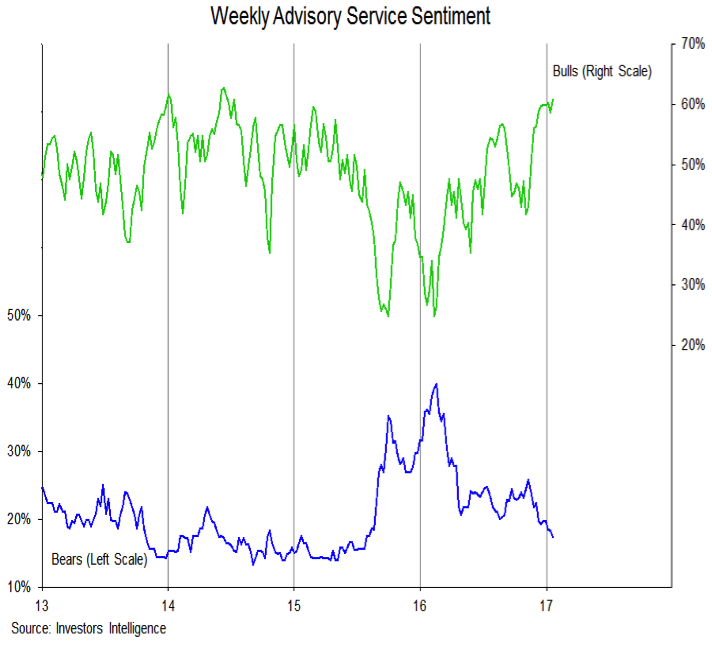
Other sentiment surveys, however, suggest optimism is well entrenched. The Investors Intelligence data shows that among advisory services Bulls have moved to a new cycle high and bears have slipped to a new cycle low. Bears are at their lowest level since mid-2015 while bulls are at their highest since mid-2014. This week the NAAIM Exposure index moved higher for the first time in four weeks, as active investment managers increased their allocation to equities. Overall, it is hard to suggest that excessive optimism has ceased to be a near-term headwind for stocks.
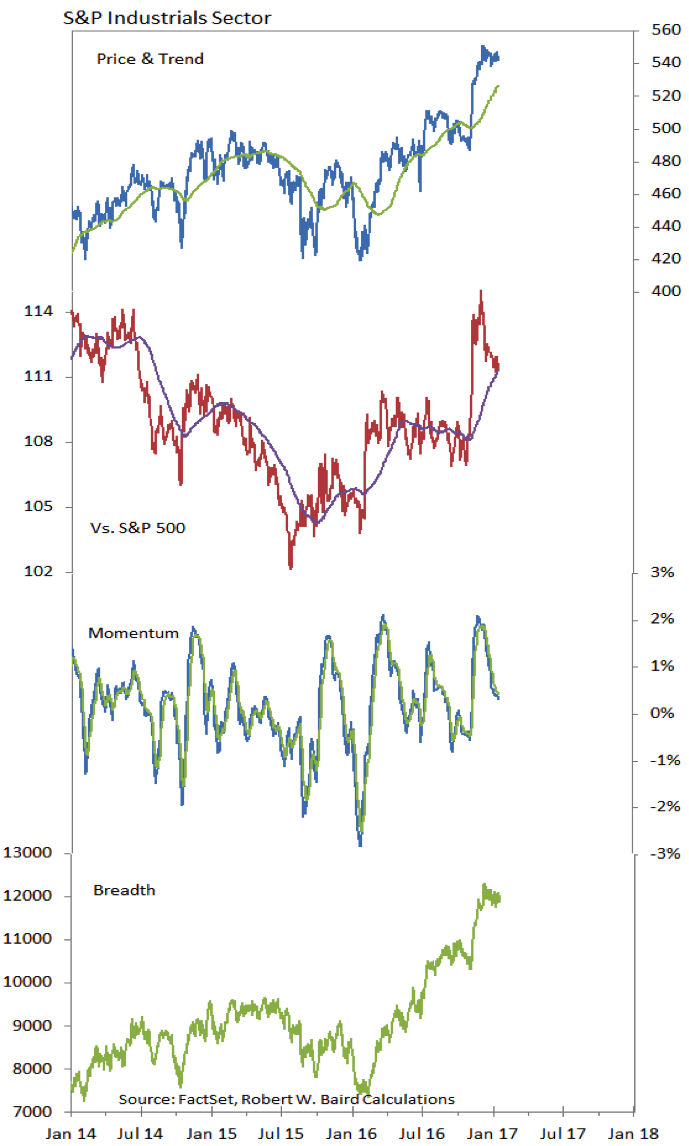
S&P 500 Industrial Sector
In our sector rankings, the Industrials sector has slipped from the third spot to the seventh spot over the past two weeks and is on the cusp of falling out of the leadership group. The chart confirms some of this recent relative price weakness. However, both the relative price line and momentum have pulled backed to support, while breadth and absolute price remain strong. While the sector may have gotten ahead of itself on a short-term basis, the longer-term trends are improving and it appears poised to remain a relative leader.
Thanks for reading.
Twitter: @WillieDelwiche
Any opinions expressed herein are solely those of the author, and do not in any way represent the views or opinions of any other person or entity.

: Showing Some Signs of Emerging Strength")
