Weekly Market Outlook & Technical Review – January 20th
In this research note, we will look at some key stock market indicators, the health of the S&P 500 Index (INDEXSP:.INX), and a handful of emerging themes that we are watching in our investing research:
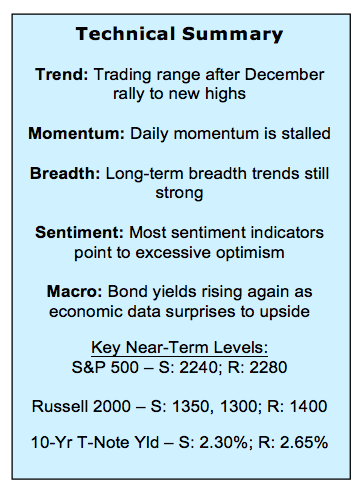
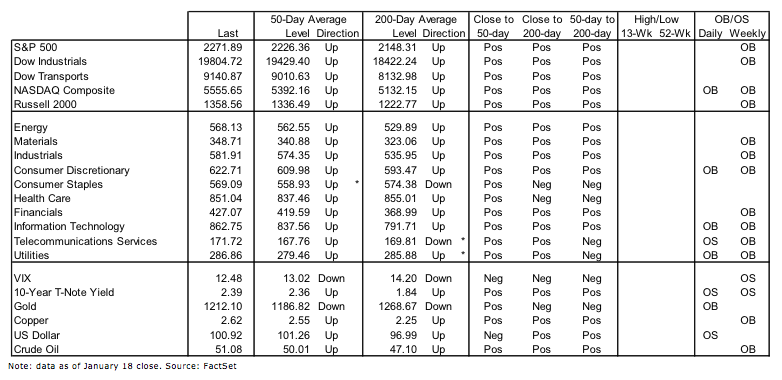
Indexes Continue Moving Sideways – Both the S&P 500 and the Dow Jones Industrials (INDEXDJX:.DJI) continue to move sideways within a historically narrow range. This continues to weigh on momentum and short-term breadth continues to be relatively lackluster. While longer-term trends for price, momentum, and breadth remain generally strong, there are still areas struggling with longer-term resistance.
Looking for Recent Leaders to Get Back in Gear – Evidence that the broad indexes are poised to resume their rally could first come from recent leaders getting back in gear. The Dow Transports are showing some evidence of leadership relative to the Industrials, and while the financial sector has been relatively resilient, we are not yet seeing renewed relative strength from the Broker/Dealer Index.
Individual Investors Show More Caution, but Overall Optimism Still Elevated – The latest data from the AAII shows individual optimism at its lowest level since before the November election, while pessimism is at its highest level since prior to the election. This contrasts sharply with advisory service data that shows a new cycle high in optimism.
Stock Market Indicators
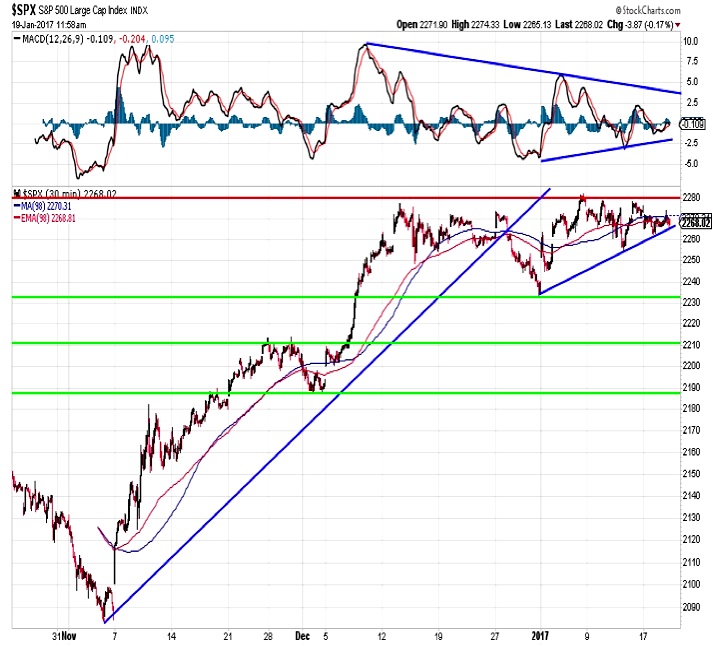
S&P 500 Index
The S&P 500 has made a series of higher lows on the intra-day chart since the beginning of the year, but really remains firmly entrenched in a nearly two-month-long sideways trading pattern. Momentum does not yet suggest an upside breakout is imminent (nor does it suggest a breakdown is just ahead). We continue to view day-to-day swings within this range (2280 on the upside and 2240ish on the downside) as mostly just noise.
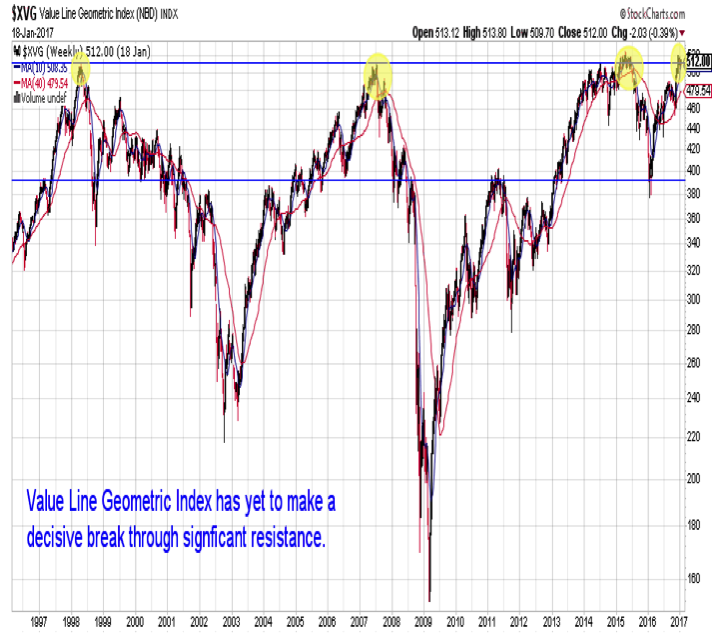
Value Line Geometric Chart
Many areas of the market have used the last two months to consolidate breakouts to new highs (or in the case of the Dow Industrials repeatedly attempt to clear a new round-number threshold). The Value Line Geometric Index, on the other hand, has struggled to break through a long-term resistance level.
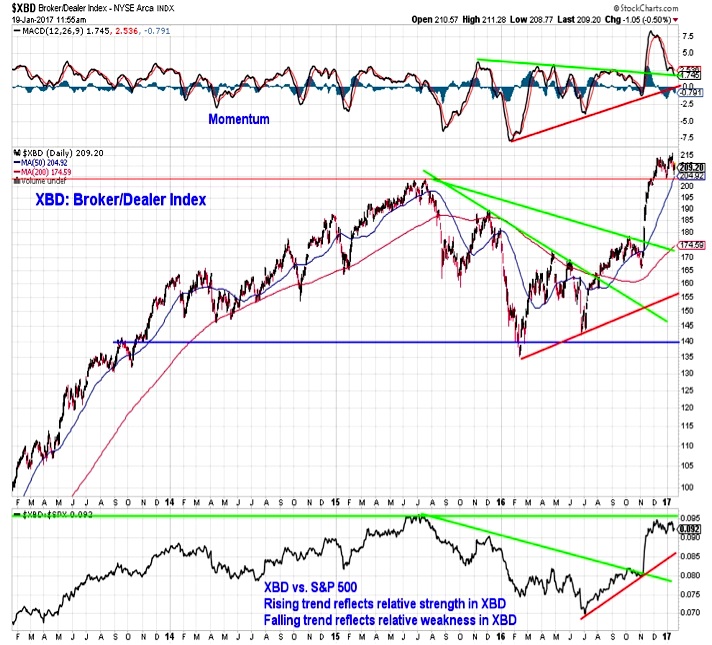
Broker-Dealer Index
The Broker/Dealer index rallied strongly in the second half of 2016 on both an absolute and relative basis. While it broke out to a new high on an absolute basis (and has spent the past two months consolidating above support), it did not make a new high on a relative basis (and has spent the last two months consolidating just below resistance). Momentum has pulled back and could be approaching an important support level, but there is little evidence that a price rally (either absolute or relative) is re-emerging.
continue reading on the next page…

: Showing Some Signs of Emerging Strength")

