The stock market has been down right nasty of late. The S&P 500 (NYSEARCA: SPY) is showing up oversold every single day this week.
It’s the first time with multiple oversold daily clusters and a cluster on the weekly chart since the lows of 2009.
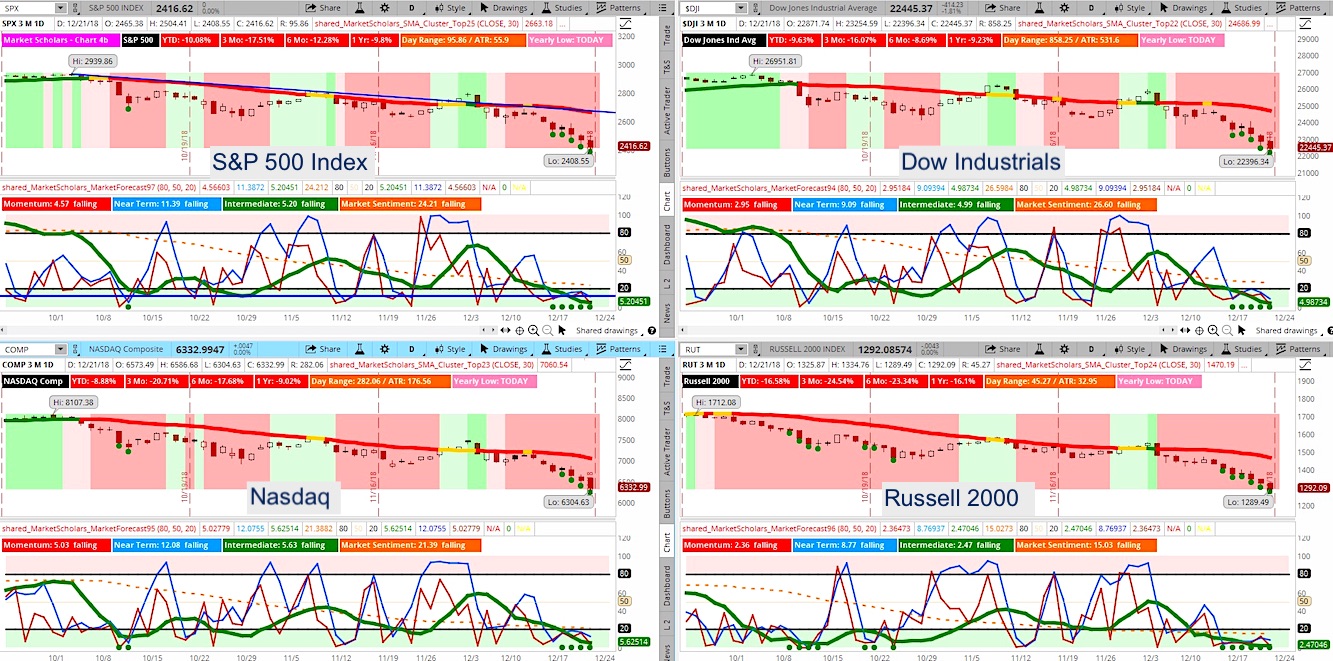
The Russell 2000 is showing 6 daily clusters in a row with 2 weekly clusters (same with the NASDAQ Composite). See chart of all 4 major stock market indices further below.
That said, we still haven’t seen a long lower shadow on a weekly chart that typically signals a reversal on weekly chart. Monthly candles with large declines typically show lower shadows, which suggests there may be a bounce early next week.
The S&P 500 is nearing a 50% Fibonacci retracement of the move from early 2016 lows to the September 20 high.
The S&P 500 has also closed 2 standard deviations below the 1-year AND the 5-year linear AND the 10-year linear regression trendlines. It closed significantly below its 8-day EMA and 30-day SMA (10% below).
It’s also trading nearly 14% below the 200-day SMA – more than any other time since Fall 2018 (credit downgrade)
The 4-week range for the S&P 500 hit nearly 400 points. One-year return expectations going forward from similar lows average close to 20+%.
Subscribe to the Market Outlook daily email list to get the daily and weekly overbought and oversold Market Forecast clusters watchlists for the S&P 500:
Weekend Market Outlook Video – Week of December 24:
Below are additional bullet points of market items discussed in this weekend’s video:
- Volume and Volatility hit high water marks for the Q4 pullback. Volatility closed at high levels without a long upper shadow. This pattern usually is followed by a drop in volatility the following week.
- Stock Market indices:
- Risk off asset class performance – Dollar and short-term bonds up. Long-term bonds, gold, stocks and commodities all lower.
- Value outpacing Growth stocks. Emerging rotation from U.S. stocks into foreign stocks, especially Emerging Markets, after big declines for most of the year in these areas.
- Crude oil down nearly 40% since the October high – understated drag on risk appetite
- Odds for rate cuts in 2019 are starting to creep in. Odds for rate hike at next March meeting remain low as are the odds for the projected two rate hikes in 2019 (~10%)
- Financial Stress Index still now showing any potential signs for recession – not even close. GDP growth continues to be strong and is trending higher
- Safe haven sectors are outperforming with dollar-sensitive areas showing the biggest weakness on Sector Selector tool. Utilities still showing small gain since early October. Energy down nearly 30%. Every sector down since December 13 near-term peak (capitulation behavior)
- Bullish trade idea in Homebuilding industry that was holding up well during the recent downturn but is now showing technical reversal signs.
Twitter: @davidsettle42 and @Market_Scholars
Any opinions expressed herein are solely those of the author, and do not in any way represent the views or opinions of any other person or entity.
: Showing Some Signs of Emerging Strength")


: Showing Some Signs of Emerging Strength")