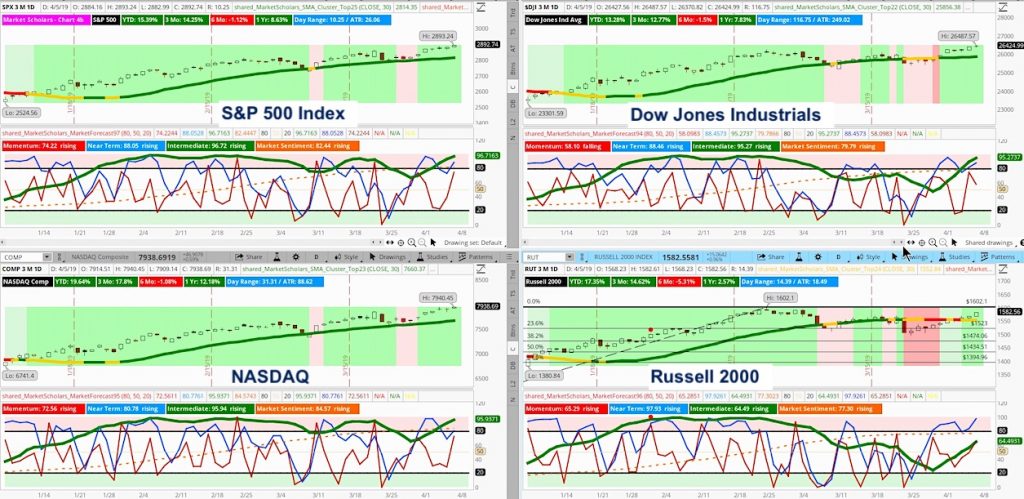
Friday marked the seventh consecutive gain for the S&P 500 Index (SPX).
As a result, the broad stock index came close to producing an overbought cluster – this time with all four lines in the upper-reversal zone, including long-term Market Sentiment. Only a smaller range on Friday kept the momentum line just below the 80th percentile.
There is a possible bearish near-term (blue line) divergence setting up – which only suggests short-term weakness, at worst. Of course, the lower intermediate (green line) low point that we are bouncing off of with this seven-day win streak suggests we may be getting closer to an intermediate pullback. This is similar to last summer’s short decline that brought the intermediate line below 50.
The Russell 2000 broke above some recent highs (after its large-cap counterparts already had previously) but still sits below its late February highs and shows a weaker bullish posture than the other major indexes.
This week marks the 13th week for the current bullish trend on the Heikin Ashi candlestick charts. The typical bullish intermediate run lasts 3 months. But, this week’s candle is strongly bullish and next week’s candle will at worst be a transition candle. So, we may still have at least a couple more bullish weeks ahead before we reach ATHs for the S&P.
Barring a major decline next week, the Russell should show a “golden cross” like the other indexes – especially if it joins them with the breakout to new recent highs
Subscribe to the Market Outlook daily email list to get the daily and weekly overbought and oversold Market Forecast clusters watchlists for the S&P 500.
Weekend Market Outlook Video – Week of April 7:
Below are some additional bullet points discussed in this weekend’s video:
- The S&P is showing a new set of 3 green arrows with a rising six-week moving average. It’s currently strongly above the 30-day SMA for this timeframe within its intermediate run. This may suggest that any moves higher in the next few weeks will lack strong momentum. The Russell also is showing renewed bullish signs on its MACD and Stochastic indicators.
- The S&P 500 formed a new four-week high. Its four-week low will shoot up rapidly this week, which will actually give the large-cap index more room to slowly move higher towards 2900+.
- Trading ranges, average volume and volatility are all falling again at low levels, which also points to slow grinding moves to the upside.
- Volatility remains at very low levels – the lowest weekly close since the bullish move began on December 24. Another reason to not anticipate strong bullish momentum.
- Asset class performance reflects a renewed risk appetite among investors – especially with a strong move higher in Bitcoin.
- Cyclical sectors and economic growth-sensitive sectors led the charge higher this week – another sign of positive risk appetite.
- Bullish trade example in Consumer Discretionary sector in a stock that benefits from a strong relative push higher in companies associated with Homebuilding.
Twitter: @davidsettle42 and @Market_Scholars
Any opinions expressed herein are solely those of the author, and do not in any way represent the views or opinions of any other person or entity.


