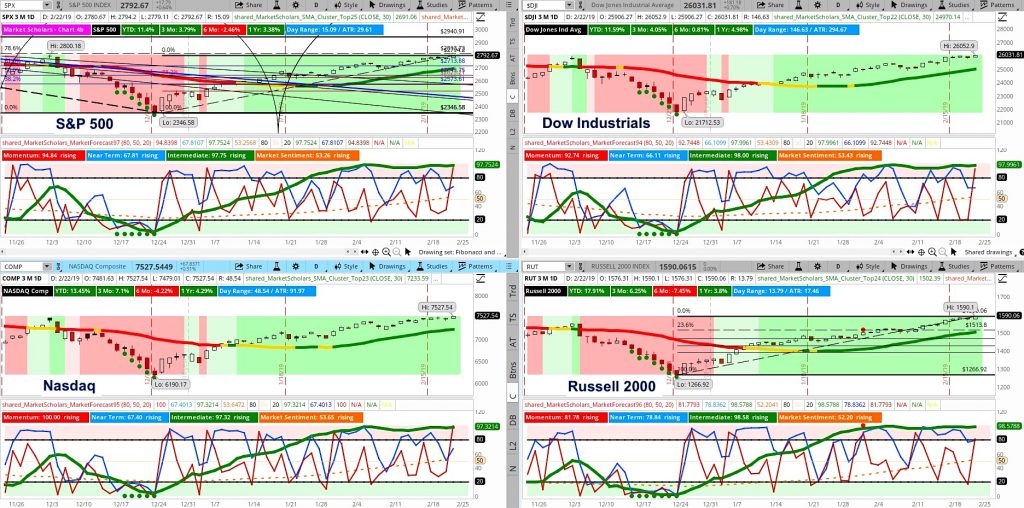
The S&P 500 is strongly bullish and extending recent gains towards big round numbers on the S&P and Dow Jones Industrial Average.
Short-term sentiment suggests today’s late rally to finish at the close may signal an extreme overbought condition that may break the 9-week winning streak
This China-trade deal rally seems eerily similar to the tax-reform rally that pre-empted an expected intermediate pullback in November 2017 that eventually led to the crazy frothy move in early 2018
While the S&P 500 is close to reaching its highs from mid-October, early November and early December, Emerging Markets (EEM and EFA) are either already there or have surpassed their corresponding highs in those timeframes
The momentum line spiked to extreme highs that usually leads to an overbought cluster when the intermediate posture has been strongly bullish for this long.
The S&P 500 is close to producing a “golden cross” between its 50-day and 200-day Mas without a re-test of the prior “death cross”. This is a good sign the long-term trend is changing back to bullish and we are not headed to a bear market (similar to 2016 and 2011).
But, that also means a re-test of the 200-day MA back to the downside is also forthcoming – common pattern after “golden crosses.”
Trend quality indicators are showing the long-term trend is still extremely noisy as we are essentially flat since mid-January 2018 despite the sharp bullish and bearish moves in the past 52 weeks.
MACD is extreme and showing bearish divergence potential still. Stochastic is also showing bearish divergences with the S&P 500’s recent higher highs.
Subscribe to the Market Outlook daily email list to get the daily and weekly overbought and oversold Market Forecast clusters watchlists for the S&P 500.
Weekend Market Outlook Video – Week of February 25:
Below are additional bullet points of market items discussed in this weekend’s video:
- Today’s range and volume were average to below-average with both values sitting at the low end of their respective averages’ 52-week ranges.
- The 4-week range is going to starting to really tighten up with this week’s low and next week’s Heikin Ashi candle open very close to current trading levels. Breaks below those levels would shows early signs of weakness and the beginning of a pullback
- Volatility broke through an important support level. Next week’s result will serve to confirm the breakout or show the potential for a fakeout and bounce higher.
- Despite the strong rally in equities, the bond market and Fed Funds futures market do not confirm the sudden increase in risk appetite. In fact, they show the opposite. There’s a big basket of economic indicators due next week, including Q4 GDP.
- Asset classes and sectors are showing money moving towards safe havens despite the run up in equity values.
- Bullish trade example in Consumer Discretionary sector. Stock is in a strong long-term bullish trend and is bouncing higher in the intermediate term. Has potential based on other indicators to make an extended run.
Twitter: @davidsettle42 and @Market_Scholars
Any opinions expressed herein are solely those of the author, and do not in any way represent the views or opinions of any other person or entity.


 – Warren Buffett’s Biggest Holding!")

 May Tip Stock Market’s Next Move")
