It’s been a rough ride for Walmart (NYSE:WMT) investors over the past 2 years.
The stock fell sharply in 2015 before rallying back in 2016. Now it’s at a crossroads heading into 2017
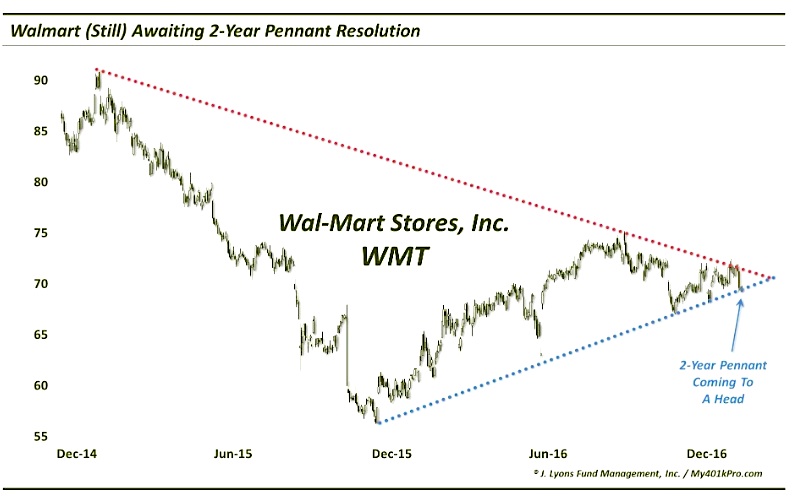
As you can see in the chart below, Walmart’s stock price has formed a pennant pattern over the past 2 years. This pattern is tightening and looks set for resolution this month. Either Walmart will lose its uptrend line and retest its 2015 lows or it will breakout above the red resistance line and attempt to break its 2016 highs.
It’s a pivotal moment for Walmart traders (and investors). Stay tuned!
Walmart (WMT) 2 Year Chart
Thanks for reading.
Twitter: @JLyonsFundMgmt
The author does not have a position in mentioned securities at the time of publication. Any opinions expressed herein are solely those of the author, and do not in any way represent the views or opinions of any other person or entity.

: Showing Some Signs of Emerging Strength")
