- The Q2 reporting period wraps up with retail
- Walmart, after issuing a pair of pessimistic outlooks, trades below important resistance and at a
- somewhat low P/E compared to recent history
We highlight an optimal options trading idea using September expiration dates
Earnings season isn’t in the books quite yet. While the second-quarter reporting period has verified better than analysts were forecasting (and perhaps had feared) the third week of August features numbers from some of the world’s biggest retailers. Among the most anticipated is Q2 results from Walmart (WMT) which is confirmed to report on Tuesday, August 16, BMO. Analysts expect $1.81 of per-share earnings, up just slightly from $1.78 reported in the same period a year ago.
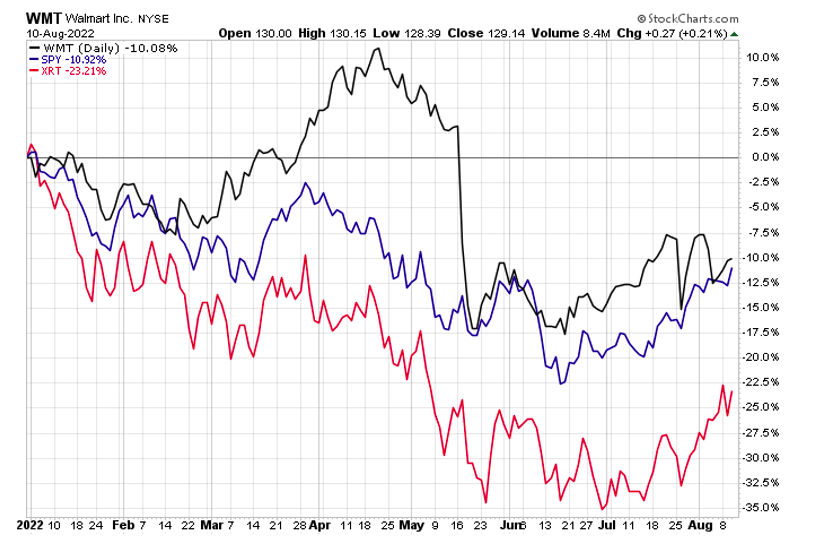
The world’s largest company by revenue, with more than $570 billion in sales, according to Fortune magazine, has seen its share price hit hard in 2022 after a pair of very cautious profit warnings over the last three months. Despite cratering after its May 17 first-quarter earnings report in which the Arkansas-based big box store reported a light earnings number and negative outlook, the stock is actually modestly outperforming the SPDR S&P 500 ETF (SPY) thus far in 2022. Moreover, with just a 10% total return drop this year, WMT is down less than half of the SPDR S&P Retail ETF’s (XRT) year-to-date drubbing.
Walmart features a P/E ratio of 21.3, which is about 9% below the average of the last dozen earnings observations.
Walmart: Beating the S&P 500 ETF and the Equal-Weight Retail ETF YTD
Option Research & Technology Services (ORATS) has built an industry-leading platform for scanning options so traders can effectively find investing ideas while managing risk. When dissecting options pricing, historical trends, and future expected stock price moves, we see an optimal neutral to slightly bearish play on Walmart shares.
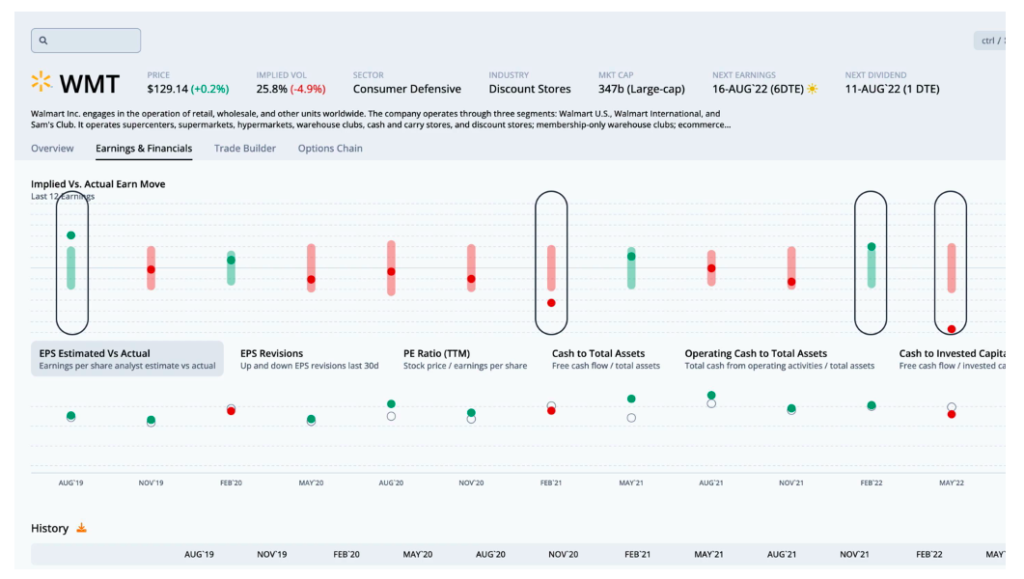
According to ORATS data, the market expects a 3.9% share price move in either direction following Tuesday’s earnings release. For context, a move of that percentage was breached in four out of the last 12 earnings reports. The graph below from our Earnings and Financials tab shows that last quarter’s move was indeed drastic. While Walmart beat EPS estimates in four out of the previous five quarters, the stock traded up after earnings just twice in the last nine releases. Only four long straddles, circled below, were profitable.
WMT Heading into Earnings: Solid Beat History, But Often Poor Price Action
ORATS’ company-level financial data can be easily sorted. To find optimal options trades, we can simply filter for fairly priced neutral, bullish, or bearish strategies. For a neutral trade, the highest-ranked idea is a long put calendar spread using the $130 strike, a key level that we will detail later.
Since it’s an earnings-related trade, we use near-dated September expirations – selling the nearer-term September 2 put and buying the later September 23 put. The net debit is $0.75. The trade seeks to take advantage of accelerating time decay on the nearer-dated puts. The max profit is seen when WMT shares are at the strike when the near-dated puts expire.
Top Trade: Neutral Long Put Calendar Spread (September) $130 Strike
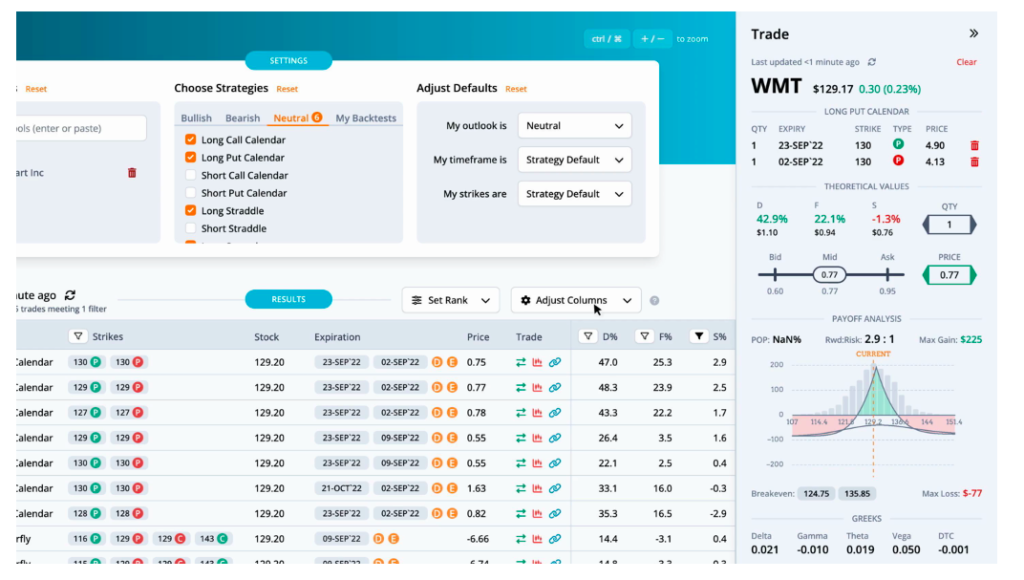
We find that the max gain to max loss ratio is a solid 2.9 to 1 ($225 to $-77). The two breakevens on the spread are $124.75 and $135.85.
Time Decay Is Our Friend
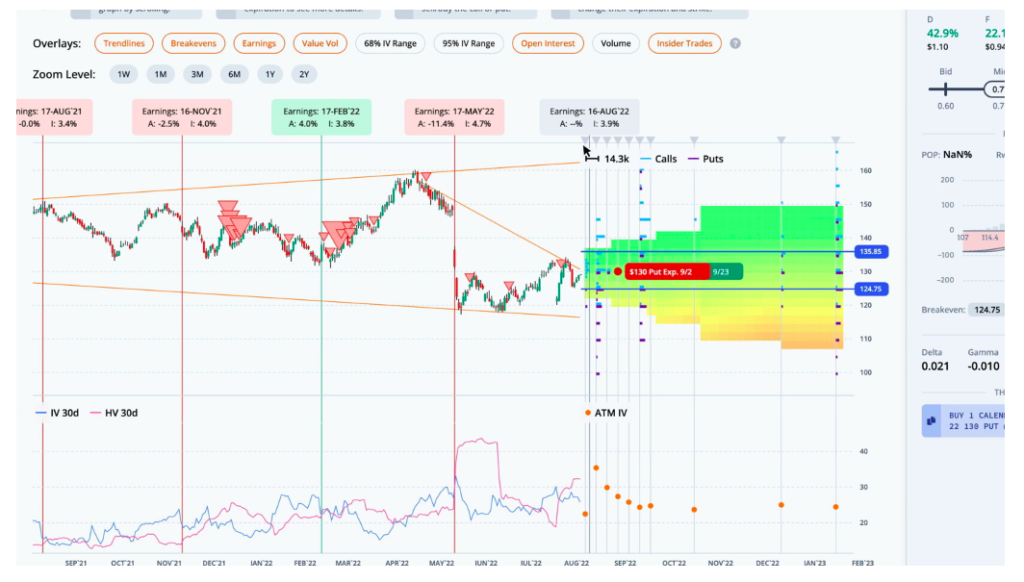
The Technical Take
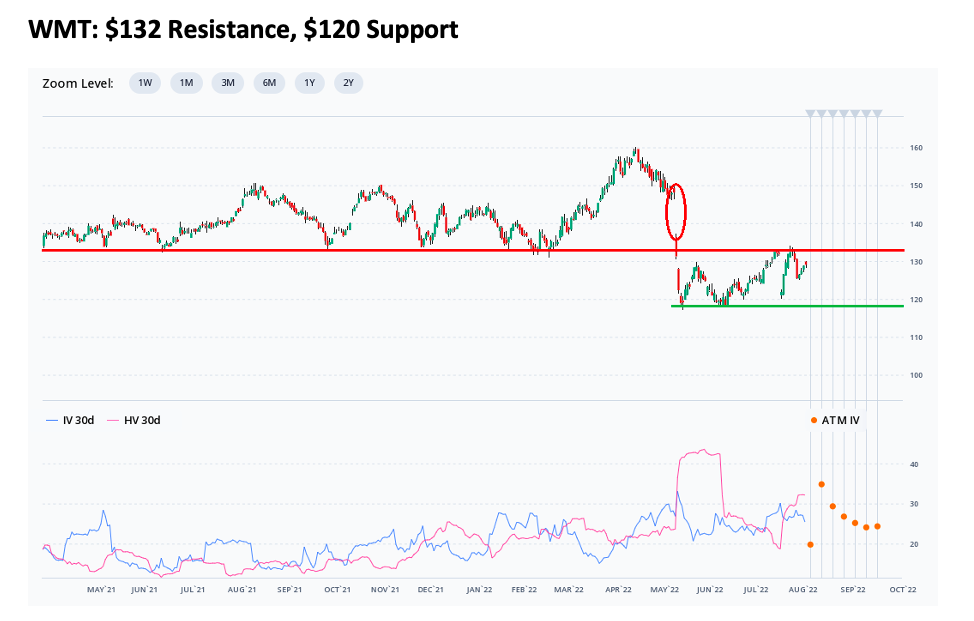
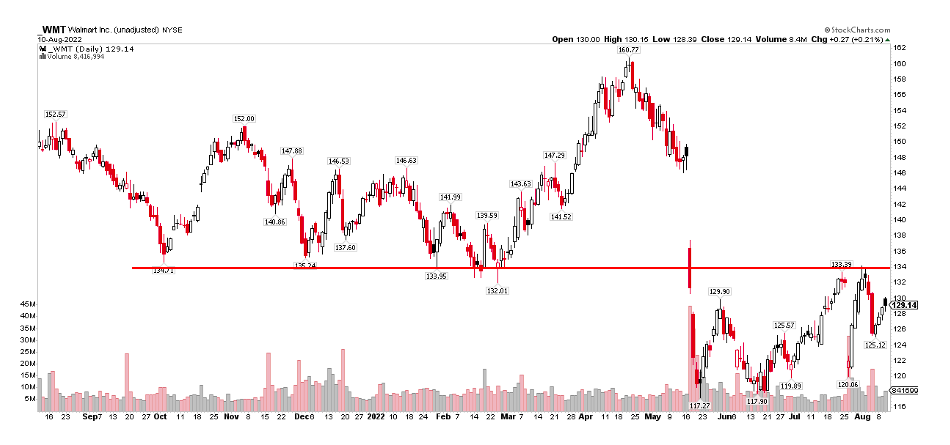
The long put calendar spread trade aligns with what the chart tells us. Notice in the one-year daily chart below that WMT routinely held the $132-$135 area on several occasions from October last year through this past February. In May, however, that dreadful Q1 earnings report sent shares cascading lower. The stock has attracted buyers at and just below $120.
Our options play uses the $130 strike, which aligns with noted resistance on the chart.
WMT: $132 Resistance, $120 Support
The Bottom Line
We like playing Walmart from a neutral stance via a long put calendar spread using options expiring in September. With shares near resistance, playing time decay makes sense in this case.
Long calendar put spread reference source: https://www.optionsplaybook.com/option-strategies/calendar-put-spread/
Charts from stockcharts found here and here.
Twitter: @MikeZaccardi
The author may hold positions in mentioned securities. Any opinions expressed herein are solely those of the author, and do not in any way represent the views or opinions of any other person or entity.

: Cup (and Maybe Handle) Watch")
 Trading Near Top Of Price Range")

