In October 2013, Mr. Market seemed unable to gain quick traction from the summer lows. Then, we shared a study of wage growth for the last decade. We noted that wage growth for the private sector continued to look anemic after almost a year since the celebrated Great Rotation began.
Anemic wage growth is a good indication that Mr. Consumer is still pinching pennies despite other indicators of an improving economy.
So what does this mean for retailers, and what can we expect for Mr. Market in 2014?
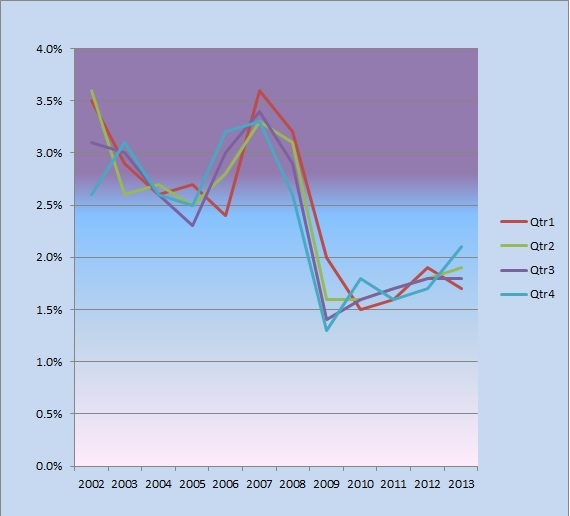
Figure 1: Wage and Salaries 12-Month Percentage Change for Private Industry (not seasonally adjusted)
Pinching pennies resulted in a disappointing holiday season for retailers. However, by early February, things looked a bit more optimistic when Q4 (blue line) wage and salary results for the private sector showed a sharp uptick from the prior year. The SPDR Retail ETF (XRT), below, found a base in response. Unfortunately, with yet another earnings season underway, the XRT is back at its 10/50 week moving average. This comes after a sharp selloff amidst disappointing retail numbers from the likes of Bed Bath and Beyond (BBBY). Moreover, despite the strong price uptrend in 2013, volume for the XRT remains light in comparison.
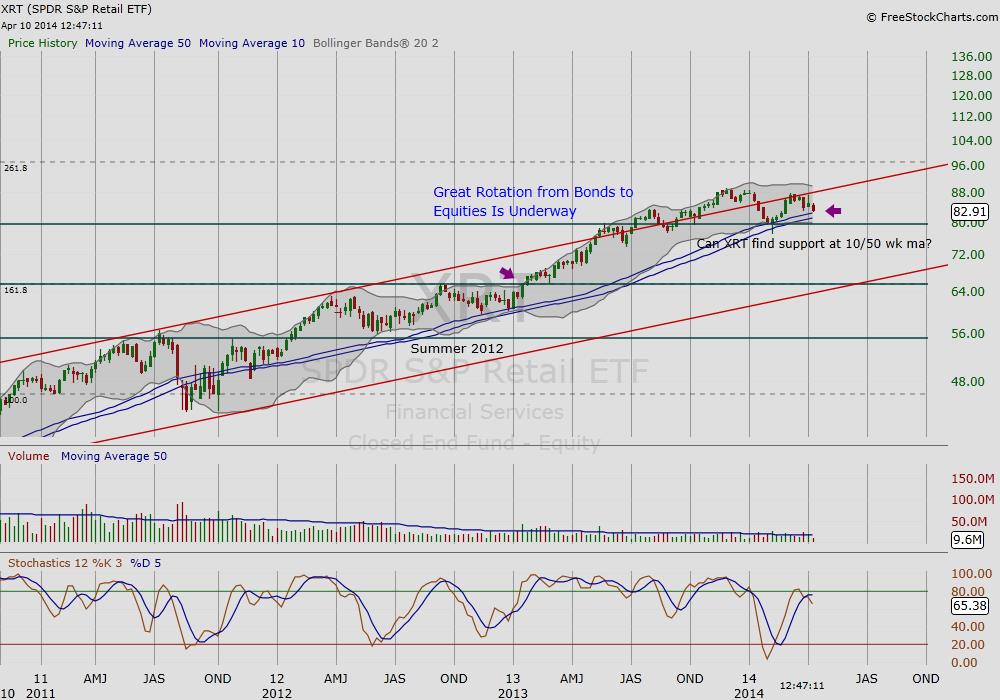
Figure 2: XRT Weekly Chart
Retailers, Wage Data and the Summer Lull
The strong uptrend in 2013 assured that even the weakest could be found riding the wave. Today, retailers are demonstrating that their great move may be in the past for now. The disappointing weekly charts below for Fossil Group, Inc. (FOSL) and Urban Outfitters, Inc. (URBN) (also highlighted in May 2013) demonstrate that at least for these retailers, some do miss the great wave. Not many expect 2014 to be a repeat of 2013, so it is worth paying attention to the laggards from 2013. Note as well that late stage market cycles do not generally lift all boats; as well, a positive with these laggards may indicate that the market picture is changing once again.
A clue for positive change may be found when Q1 wage growth data is released at the end of April. Q1 numbers (in red above) have been disappointing in prior years; a pick up could be a sign that retailers do have some life left after all. From a price chart perspective, a positive sign will be indicated if price can recover the 10/50 week moving average in volume. For now, earnings season is underway; and so far, positive news out of the likes of Alcoa Inc. (AA), but disappointing news from Bed Bath and Beyond confirm that for the time being, retailers should expect a relatively lackluster 2014.
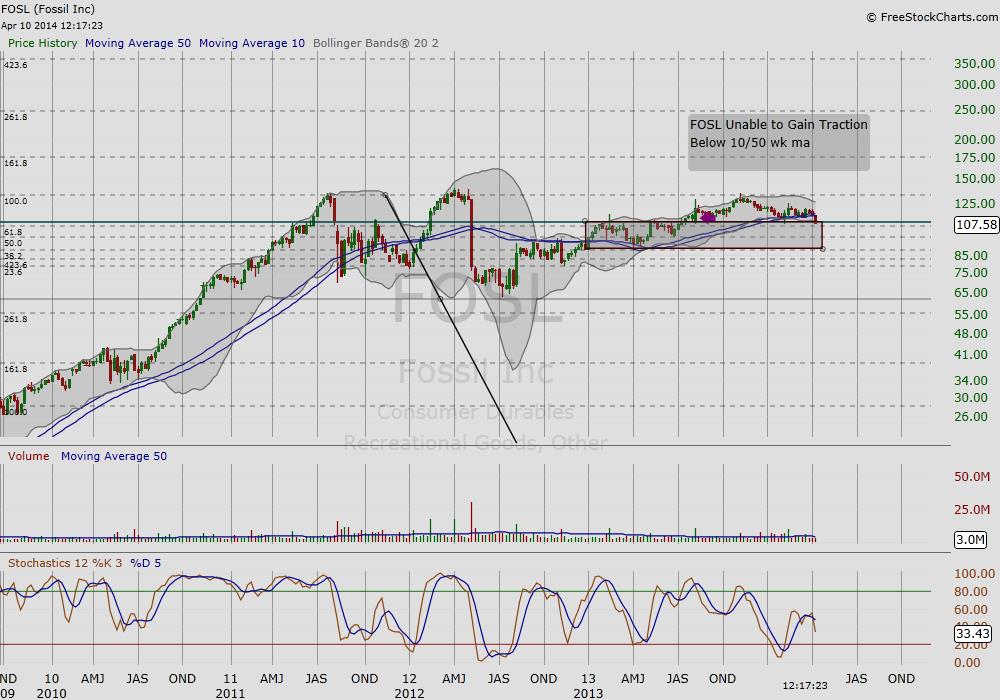
Figure 3, FOSL Weekly Chart – Unable to Gain Traction in 2013.
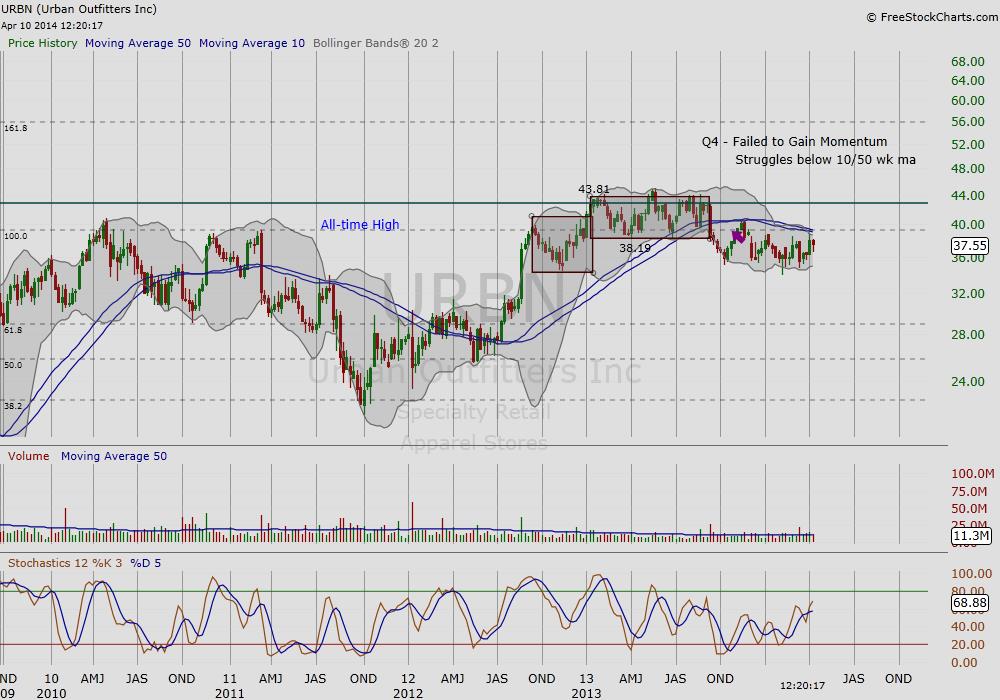
Figure 4, URNB Weekly Chart – Failure of Base of Base pattern in Q4 following a dip in Q3 wage numbers.
Thank you for reading.
Note that the wages and salaries data is from the Bureau of Labor Statistics.
No position in any of the mentioned securities at the time of publication. Any opinions expressed herein are solely those of the author, and do not in any way represent the views or opinions of any other person or entity.

: Worrisome to Broader Market?")
