Most people think the nation’s money supply is the sole cause of inflation. They fail to realize inflation has two equal dance partners.
The money supply and the velocity of the money supply dance hand in hand to determine the rate of inflation.
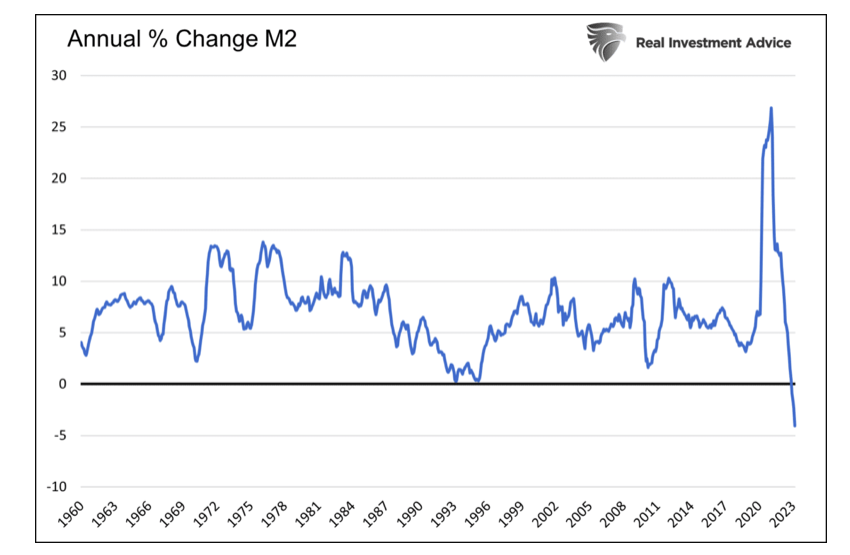
The money supply is shrinking for the first time since at least 1960. Yet, despite the most significant decline in the money supply in sixty years, inflation remains sticky. How can that be?
Given the importance of monetary velocity and its relationship with money supply, let’s better understand velocity and ponder how it may change in the coming months.
The strong correlation between bond yields, inflation, and monetary policy gives us more reason to understand and predict velocity.
Key Takeaways
- The Fed seriously erred in 2021, focusing too much on supply and not enough on demand.
- What is Monetary Velocity?
- The Fed can slow velocity, but it requires job losses and or eroding consumer confidence.
- Forecasting the money supply and velocity leads to a complete inflation forecast.
- Lacy Hunt of Hoisington Investment Management guides where velocity may be headed and what it means for bonds.
The Fed’s Big Error in 2021
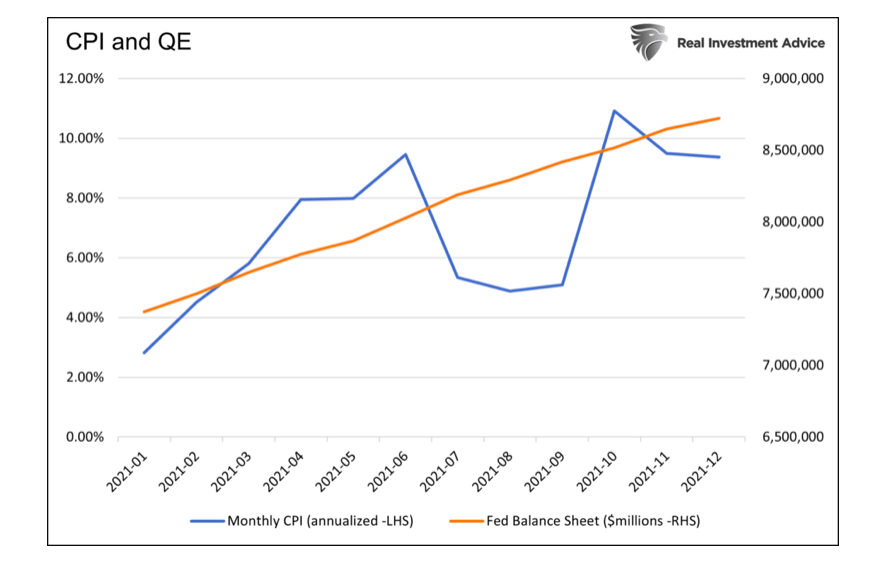
In Mid-April 2021, the BLS reported that monthly CPI was +0.66%. That equates to a nearly 8% annualized rate or four times the Fed’s 2% target. Two weeks after that April CPI report, the Fed stated:
With inflation running persistently below this longer-run goal, the Committee will aim to achieve inflation moderately above 2 percent for some time so that inflation averages 2 percent over time and longer‑term inflation expectations remain well anchored at 2 percent. The Committee expects to maintain an accommodative stance of monetary policy until these outcomes are achieved.
There was nary a concern at the Fed or on Wall Street that the recent uptick in inflation was a problem. Believing it was “transitory,” the Fed kept interest rates at zero and continued increasing their bond holdings by $120 bn a month (QE). Such dovish monetary policy would continue through the year, as shown below, despite the highest inflation in forty years.
The word “transitory” was relentlessly spoken by Powell and other Fed members to describe an expected short burst higher in prices.
We suppose the Fed reasoned that the Pandemic-related supply chain issues would ease as the vaccine took hold. At the same time, they must have thought consumer spending from the barrage of fiscal stimulus would fade, and demand would quickly fall back toward normal levels. Therefore, normalizing supply and demand would bring prices back to pre-pandemic levels.
The Fed was dead wrong!
Supply chain issues and inventory levels did normalize, but demand stayed strong. Demand remains strong despite the Fed hiking Fed Funds by 5% in little more than a year and reducing their Treasury and Mortgage holdings by $700 billion.
The Fed grossly failed to forecast monetary velocity.
What is Monetary Velocity?
Per the St. Louis Fed:
The velocity of money is the frequency at which one unit of currency is used to purchase domestically- produced goods and services within a given time period. In other words, it is the number of times one dollar is spent to buy goods and services per unit of time. If the velocity of money is increasing, then more transactions are occurring between individuals in an economy.
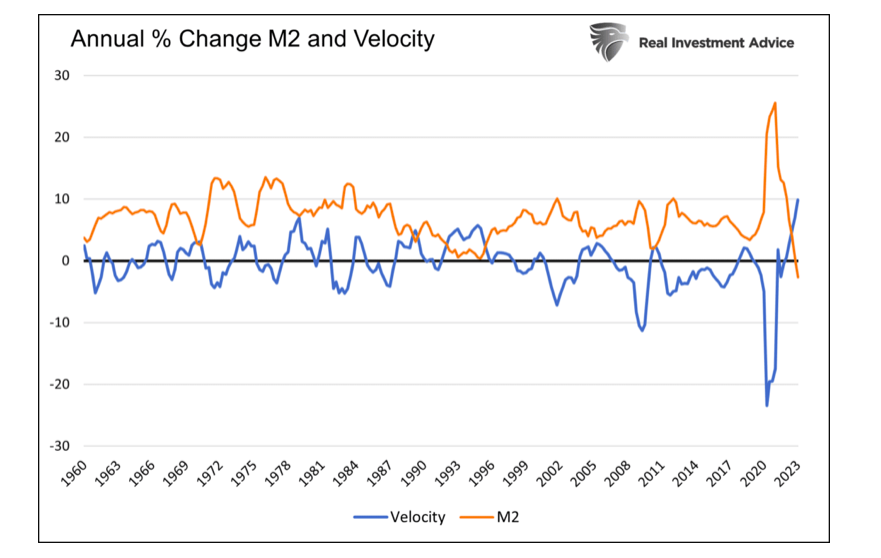
Most financial pundits assume it’s the money supply that drives inflation. However, velocity, measuring how often the money supply circulates through the economy, is equally important.As the graph below shows, the money supply is falling but being offset by increasing monetary velocity.
To grasp how the supply and velocity of money dictate prices, ask yourself how inflation would be impacted if the Fed printed a gazillion dollars tomorrow.
Is the answer the same if we instead asked, what if the Fed printed a gazillion dollars but immediately locked it up in a vault and sent it into outer space?
We can parse Fed speeches and transcripts and know they now acknowledge that velocity matters.
Slowing Velocity Requires Pain
The only way to slow velocity is to weaken the economy and reduce consumer confidence. Unfortunately, higher interest rates and QT are not helping this time. Often the most prominent factor causing consumer confidence and increasing one’s propensity to spend is a person’s employment situation.
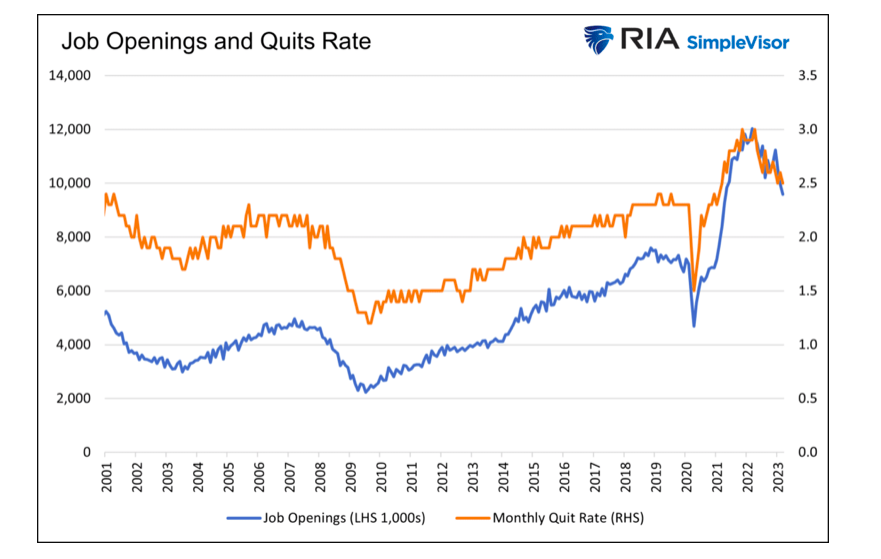
A tight labor market, as we have, creates job security and higher wages and incentivizes workers to seek new jobs with better salaries. The graph below shows the number of job openings, and the Quits Rate soared after the pandemic but is finally moderating. Consumer confidence is falling as the labor market normalizes.
The Fed has significant control over the money supply via its balance sheet. They indirectly control consumer and corporate confidence and demand via interest rates and narratives.
For the first time in our memory, the Fed predicted a recession. The minutes from the March 22, 2023, Fed meeting stated:
“Given their assessment of the potential economic effects of the recent banking-sector developments, the staff’s projection at the time of the March meeting included a mild recession starting later this year, with a recovery over the subsequent two years.”
For a complete understanding of the interplay between the money supply, velocity, economic activity, and inflation, we recommend reading our 2018 article Stoking the Embers of Inflation.
How Will Money Supply and Velocity Change Going Forward?
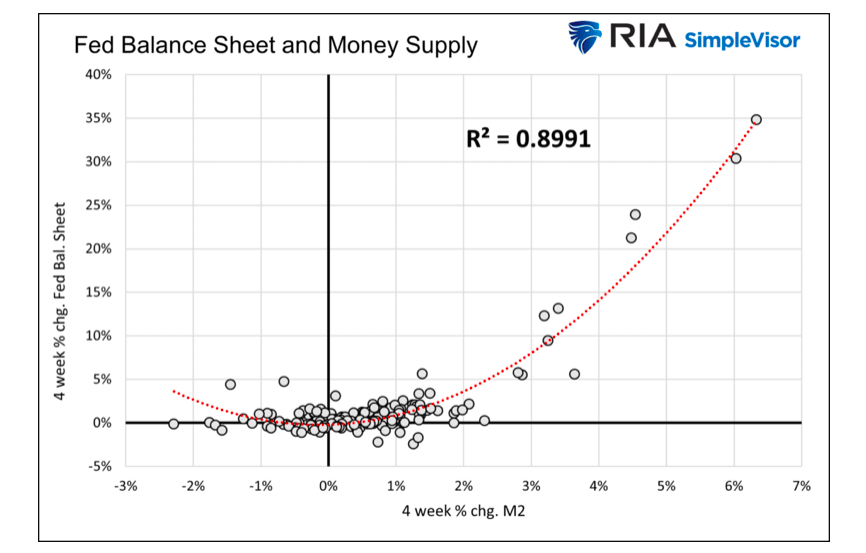
The money supply is relatively easy to forecast. The graph below shows that the change in the size of the Fed’s balance sheet has a statistically significant relationship with the money supply. The Fed expects QT to reduce the Fed’s balance sheet by $95 billion a month for the foreseeable future.
The other primary determinant is credit growth. With financial standards tightening and banks likely to lend less, along with QT, the money supply will likely continue to shrink.
And Velocity
Velocity is a function of the money supply and economic activity. To help better assess how it may change going forward, we summarize Hoisington Investment Management’s First Quarter Review. Click HERE for the entire article.
Hoisington writes that velocity “is determined by the marginal revenue product of debt and the loan to deposit ratio (L/D).”
The marginal revenue product of debt, or effectiveness of debt, will undoubtedly turn lower as over $20 trillion of U.S. debt matures in the next two years and must be reissued at higher interest rates. Having to allocate more capital toward interest payments from productive investment weakens productivity, a key driver of economic growth. For equity analysts, think of this figure as the return on capital.
Loan growth will slow considerably in conjunction with weakening economic activity. While not mentioned in their report, the regional banking crisis further ensures that loan growth will slow.
As a result of both points, velocity and, therefore, inflation should turn down.
Also, given the Fed’s desire to firmly squash inflation, the Fed may have limitations in its ability to lower rates or use QE to combat weaker growth. Such will only provide more impetus for inflation to fall.
Summary
Many economic indicators point to weakening economic growth. Further, with excess pandemic-related savings vanishing and credit card debt exploding, the means to spend and keep velocity elevated are eroding.
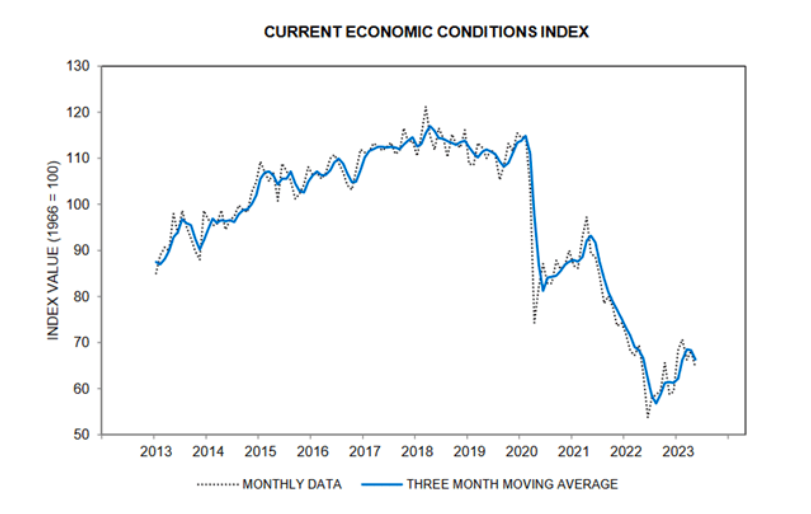
The labor force is showing some, albeit small, signs of weakening. In addition to the JOLTs graph we shared, initial jobless claims have recently risen above the 2019 pre-pandemic average. The latest University of Michigan consumer confidence, shown below, is declining after increasing over the last 12 months.
The money supply will continue to decline. Consumer and business confidence is eroding, and loan growth is slowing rapidly. Consequently, monetary velocity will likely reverse in the coming quarters.
Unfortunately, we need the quarterly GDP data to calculate velocity, so while velocity may be declining in the real world, it could take six to eight months to see its decline.
If the money supply and velocity fall, inflation rates will decline. As a result, bonds and other interest rate-sensitive stocks and instruments will likely benefit.
We leave you with the final sentence of Hoisington’s article:
Therefore, with the historical pattern of the financial, GDP, and price/labor cycles preceding on its well-documented path, this year’s decline in long-term Treasury bond yields is expected to continue.
Twitter: @michaellebowitz
The author or his firm may have positions in mentioned securities at the time of publication. Any opinions expressed herein are solely those of the author, and do not in any way represent the views or opinions of any other person or entity.

: Worrisome to Broader Market?")

