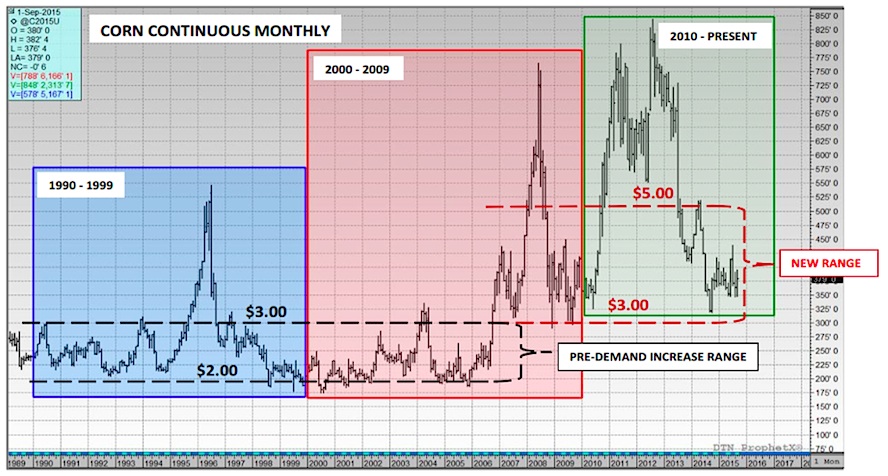
- From 1990 to 1999 total US corn demand grew 1,754 million bushels; during that time period corn futures managed one major rally in 1996 that was largely a function of the US corn yield falling to 113.5 bpa in 1995/96 (down 19% from the previous year), which resulted in record low carryin stocks of just 426 million bushels in 1996/97
- From 2000 to 2009 total US corn demand grew 3,301 million bushels; during that time period corn futures managed an upward paradigm shift in price with a new “floor” being established late in 2006 near $3.00 per bushel. I believe the higher price floor was at least partially related to corn-ethanol demand growth. The explosive corn rally in 2008 was a combination of successive macro-related events involving the investment banking collapses of Bear Sterns and Lehman Brothers, among others. It should also be noted that the Dollar Index traded down to its lowest level on record, which sent investors racing to own commodities as a hedge against inflation. I wouldn’t necessarily attribute the ’08 rally to corn specific events.
- From 2010 to present total US corn demand has grown 722 million bushels and is on pace to grow 1,300 million bushels by 2019 (similar growth rate to the 1990’s); the significantly higher trading ranges established from 2010-2012 were due to corn yields falling slightly below trend in 2010 and 2011 followed by the devastating drought in 2012. However in the absence of a weather threat and with just limited demand increases since then, corn futures from last half 2013 through the present have fallen back into a much more confined trading range. This unfortunately could be the new normal going forward. (See chart page 4).
SUMMARY: Ultimately for corn prices to attain yet an even higher price floor in the future, as they did during the last half of 2006, corn demand needs to grow consistently. Higher demand necessitates higher yields that encourages a larger risk premium in corn futures values every spring (less margin for error regarding the need to avoid even a slightly below-trend national corn yield), which in turn generates interest and increased market participation from money managers. Without that tangible demand increase, which I currently don’t see…I’m afraid Corn Bulls will be back to playing the “drought card” every summer or waiting for the next financial disaster.
Additional Charts and Resources:
Corn Historical Prices (Continuous)
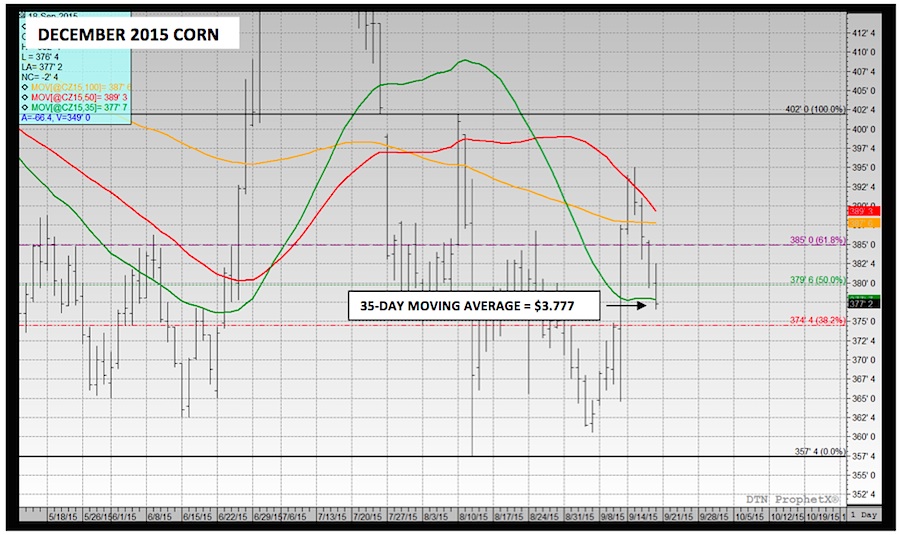
December Corn Futures Chart
Thanks for reading and have a great week.
Twitter: @MarcusLudtke
Data References:
- USDA United States Department of Ag
- EIA Energy Information Association
- NASS National Agricultural Statistics Service
Any opinions expressed herein are solely those of the author, and do not in any way represent the views or opinions of any other person or entity.

 Trading Near Top Of Price Range")


